
The NZD/USD pair continues to trade with a clearly defined bearish structure, holding near 0.5720–0.5730 and extending losses from the prior week’s decline. Price action remains locked in a descending short-term channel, with lower highs forming since the recent peak near 0.5850, confirming ongoing distribution pressure across the FX spot market.
At current levels around 0.5729, the pair sits only ~0.4% above the YTD low at 0.5681, indicating limited recovery capacity and persistent downside momentum. ClearSky Capital’s brokers examine this topic in detail in the article.
Fundamental Drivers: Elevated Geopolitical Risk Premium and Risk Aversion
Geopolitical risk in the Middle East is the main macro driver, with shifting US–Iran negotiation signals increasing uncertainty. A tentative 60-day de-escalation plan tied to safe Strait of Hormuz transit briefly supported sentiment, but renewed tensions and reports of restricted passage have raised volatility across energy and FX markets.
This has driven higher risk aversion, supporting the USD and pressuring commodity currencies, while equity risk premiums and credit spreads have widened. FX volatility has also risen roughly 8–12% over the past week, reinforcing a more defensive market stance.
FX Flow Dynamics: USD Strength Versus NZD Vulnerability
The US dollar index (DXY) continues to benefit from a defensive reallocation of global capital, with NZD/USD particularly sensitive due to its high beta coefficient to global growth expectations.
The New Zealand Dollar remains exposed to a negative correlation with global PMI momentum, meaning it tends to weaken when global manufacturing and services activity slows. It is also highly sensitive to commodity price expectations, which makes it particularly vulnerable when outlooks for key exports soften.
In addition, reduced carry attractiveness relative to the stability of USD yields continues to weigh on demand for the NZD. As a result, the currency is underperforming not only against the US Dollar but also against other major currencies, reflecting broad-based weakness across risk-sensitive FX pairs.
The current pricing behavior indicates net directional USD demand exceeding NZD inflows, with spot liquidity clustering near the 0.5700 psychological threshold, suggesting potential stop-loss accumulation below this level.
Technical Analysis: Momentum Indicators Confirm Bearish Continuation
From a technical standpoint, NZD/USD continues to exhibit bearish momentum confirmation across multiple timeframes, particularly on the 4-hour and daily charts.
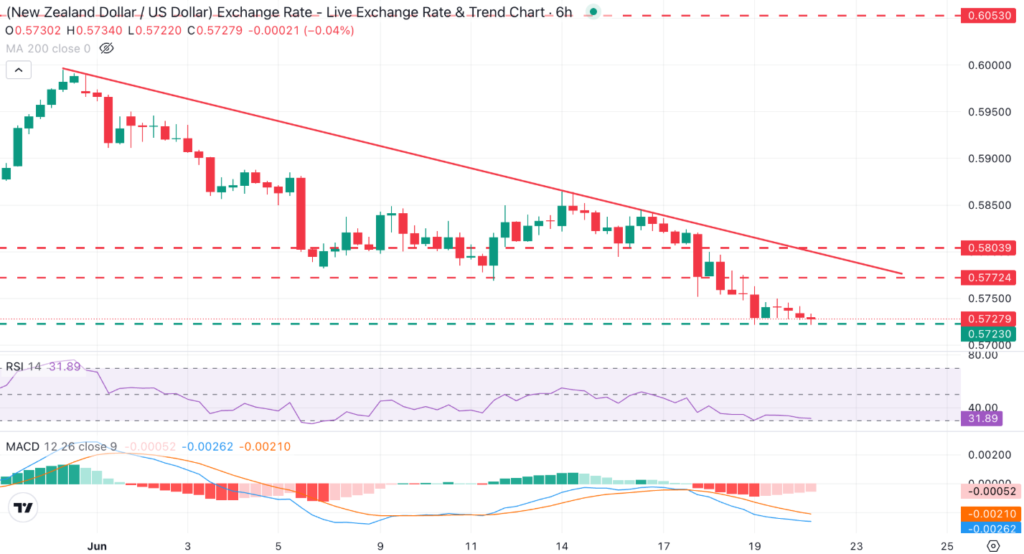
The Relative Strength Index (RSI 14) is currently positioned near 33, reflecting sustained bearish momentum while approaching oversold territory below the neutral 50 threshold.
Historically, sustained trends in NZD/USD during risk-off cycles have extended into RSI ranges between 28 and 35 before meaningful corrective rebounds occur, implying that downside exhaustion is not yet confirmed.
The MACD histogram remains negative, with the signal line maintaining separation below the zero axis. This confirms that downside momentum is still expanding rather than contracting, even though the rate of decline has marginally slowed compared to last week’s impulse leg.
Price remains capped below a short-term resistance band at 0.5720–0.5740, which has repeatedly acted as a rejection zone. Multiple intraday failures at this level reinforce its role as a supply concentration area, where sell-side liquidity is actively absorbing rebounds.
Key Levels: Structural Support at YTD Low in Focus
The immediate downside focus remains the 0.5681 YTD low, which represents a critical structural pivot. A sustained break below this level would confirm a bearish continuation breakout, potentially triggering a measured move extension toward the 0.5600–0.5580 region, corresponding to prior liquidity clusters from late 2025.
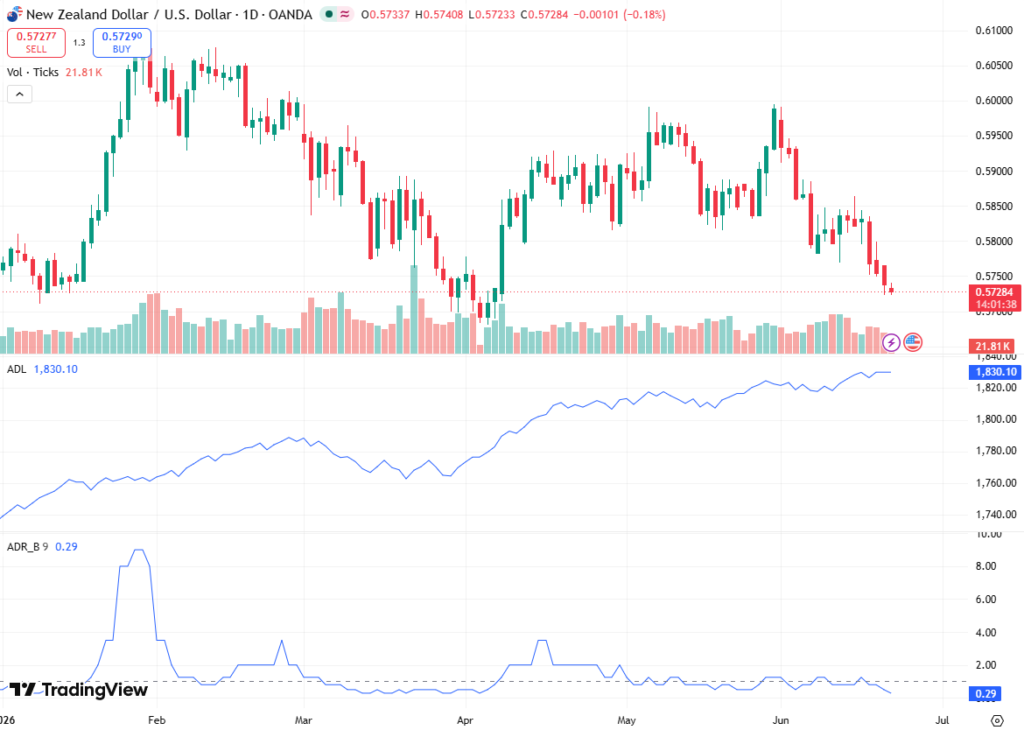
Below this zone, the next macro support area is positioned near 0.5550, where historical demand previously stabilized prices during high-volatility contraction phases.
On the upside, recovery attempts face layered resistance. The first barrier remains at 0.5770, aligning with the most recent swing high and representing a ~0.7% retracement from current levels.
Beyond that, the 0.5800 region represents a structurally significant resistance zone, defined by the intersection of a descending trendline originating from May highs and a prior consolidation breakdown zone near June 18 highs.
A break above 0.5800 would be required to invalidate the current bearish structure and shift momentum toward a neutral regime.
Outlook: Bearish Regime Remains Intact with Extension Risk
The NZD/USD pair remains firmly positioned within a bearish continuation regime, driven by the convergence of geopolitical risk premiums, USD strength, and deteriorating momentum indicators.
Unless there is a clear reduction in global uncertainty or a material shift in rate differential expectations, price behavior continues to favor downside extension. The probability distribution remains skewed toward a test of the 0.5681 YTD low, with increasing risk of a downside break toward 0.5600 territory if risk-off conditions persist.
Overall, the market structure, momentum profile, and macro flow dynamics all confirm that NZD/USD remains in a technically driven downtrend with limited recovery capacity in the near term.


