
The USD/JPY pair continues its aggressive bullish extension, advancing toward the 161.75 region, which sits just below the broader 162.00 multi-year resistance area last seen in July 2024.
Price action confirms sustained acceptance above the key 160.50–160.60 supply zone, a level previously associated with heightened sensitivity to policy intervention risk and liquidity imbalances. ClearSky Capital’s brokers provide a detailed exploration of this topic in this article.
The market is now trading in a clear trend expansion regime, where price remains consistently above short, medium, and long-term equilibrium levels. Current deviation from the 20-day moving average is approximately +2.5% to +3.0%, reflecting a statistically stretched condition relative to recent realized volatility.
Macro Backdrop: Yield Divergence and Risk-Driven USD Demand
The main macro driver remains the wide US–Japan yield differential, which continues to support USD/JPY flows. The 10-year spread of roughly 350–400 bps keeps the carry trade attractive for long USD positions funded in JPY.
At the same time, geopolitical tensions around Middle East energy routes have increased global demand for USD liquidity, but have not produced typical safe-haven inflows into the yen. This reflects the JPY’s role more as a funding currency than a defensive asset, limiting its upside strength.
Overall, the combination of positive carry, steady US rate expectations, and weak yen funding demand continues to maintain a structurally bullish backdrop for USD/JPY.
Momentum Conditions: Strong Trend With Overbought Compression
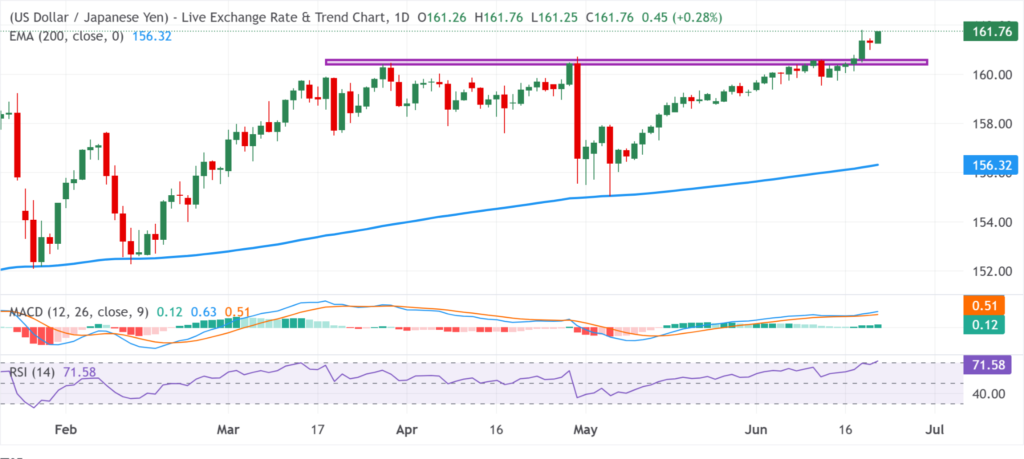
Technical momentum indicators confirm strong but increasingly stretched conditions. The Relative Strength Index (RSI) is positioned near 72, firmly above the standard overbought threshold of 70, indicating that bullish momentum is becoming statistically extended.
Historically, RSI readings in this range during USD/JPY trending phases tend to precede either short consolidation phases or sharp volatility resets, rather than immediate trend reversals. This reflects a condition where momentum remains positive, but upside efficiency begins to decline.
The MACD indicator remains above the zero line with a positive histogram, confirming ongoing bullish momentum. However, the rate of histogram expansion has begun to flatten, suggesting a transition from acceleration phase into late-cycle trend maturity, where directional gains often become less linear.
Trend Architecture: Moving Average Alignment and Breakout Validation
From a structural standpoint, USD/JPY remains firmly aligned in a bullish configuration. Price is trading well above the 200-day Exponential Moving Average (EMA) at 156.32, confirming a sustained macro uptrend.
The breakout above the 160.50–160.60 resistance band represents a significant structural development, as this zone previously acted as a repeated defensive level associated with intervention concerns and liquidity absorption. The decisive breakout above this region indicates strong demand absorption and continuation of upward imbalance.
The moving average structure remains fully bullish, with price above the 20-day EMA, 50-day EMA, and 200-day EMA, reinforcing multi-timeframe trend consistency.
Volatility and Market Regime: Expansion With Fragility
Volatility conditions show elevated but stabilizing behavior. The Average True Range (ATR) remains consistent with expanded daily ranges near 0.9% to 1.1%, reflecting active participation and strong directional flow.
However, volatility behavior in extended trends often becomes asymmetric. In this environment, upside movement tends to occur in impulsive bursts, while downside reactions become sharper and more abrupt due to leveraged positioning and thin liquidity pockets near highs.
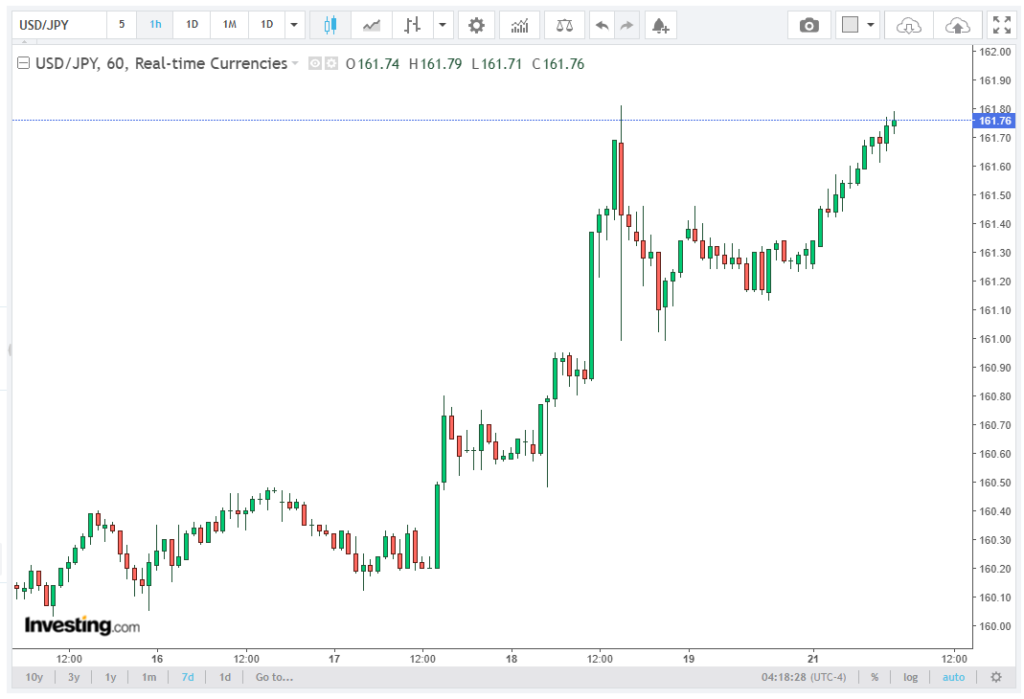
This creates a market regime where trend strength coexists with rising fragility of continuation, particularly as price approaches psychologically important resistance zones.
Key Technical Levels and Structural Zones
Immediate price action is focused on the 161.75 resistance area, an extension of the broader 162.00 ceiling with historical significance and proximity to prior reaction highs.
A sustained break above this zone would suggest continuation into lower-liquidity conditions, where upside moves could accelerate due to limited overhead supply.
On the downside, initial support sits at 160.50–160.60, a former breakout area now acting as a bullish pivot. Holding above this level keeps the broader uptrend intact, with pullbacks still viewed as corrective.
Below that, 158.80–159.20 marks a secondary demand zone based on prior consolidation, while the 200-day EMA at 156.32 remains the key macro threshold separating continued bullish structure from potential trend reversal risk.
Outlook: Strong Trend With Increasing Intervention Sensitivity
The USD/JPY outlook remains structurally bullish, driven by sustained interest rate differentials, continued USD demand strength, and persistent JPY weakness under global risk conditions. However, as the price approaches the 162.00 multi-year high zone, the probability of heightened policy sensitivity and intervention risk increases materially.
While momentum remains supportive, current conditions reflect a late-stage trend environment characterized by overbought technical readings, extended deviation from moving averages, and rising volatility asymmetry.
This combination suggests that while trend continuation remains possible, the path higher is likely to become more irregular, with increased susceptibility to sharp corrective movements and liquidity-driven reversals.


