
Retail investors mapping out their core portfolio strategies face a critical question: how to capture the explosive growth potential of smaller domestic companies without taking on excessive single-stock risk?
Small-cap exchange-traded funds (ETFs) have long been the tool of choice to solve this dilemma. They grant automated, diversified exposure to hundreds of emerging firms in a single transaction.
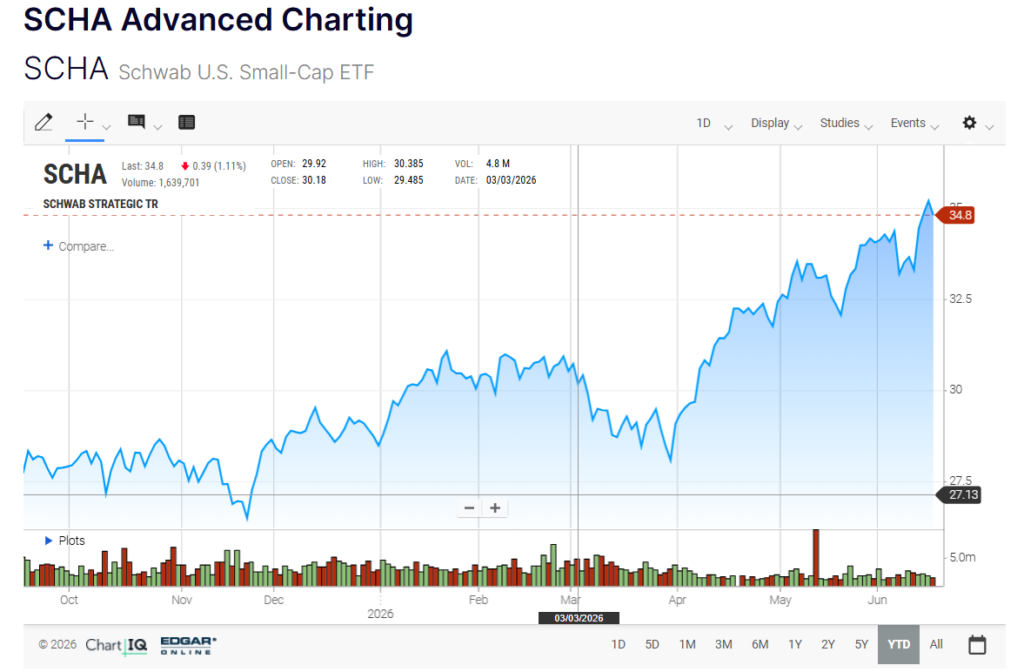
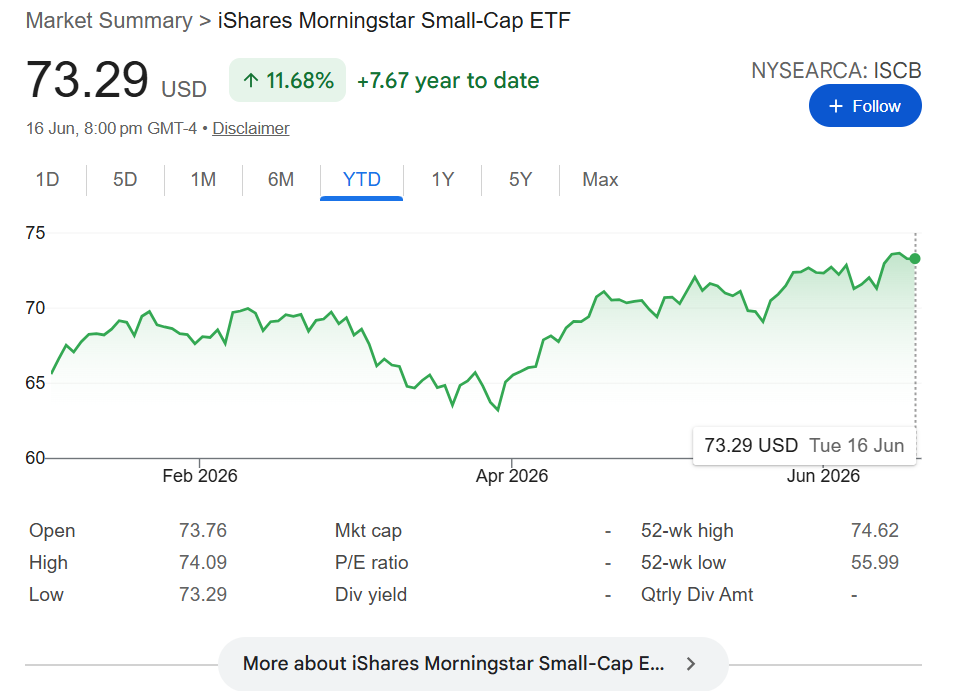
Brokers from Oryxbox dive into this topic to unpack two dominant heavyweights in this space: the Schwab U.S. Small-Cap ETF (SCHA) and the iShares Morningstar Small-Cap ETF (ISCB).
While both funds aim to anchor the small-cap segment of a portfolio, distinct differences in their underlying index structures, underlying sector weights, and dividend profiles can lead to highly divergent long-term performance paths. Evaluating these differences is vital for optimizing returns in the current economic landscape.
Core Operational Metrics and Cost Efficiencies
When evaluating standard market-cap-weighted index funds, tracking costs represent one of the few variables an investor can fully control. Minimizing these baseline fees directly preserves long-term compounding potential. Both asset management giants have structured these funds to be incredibly lean, but one maintains a razor-thin advantage.
The Schwab U.S. Small-Cap ETF (SCHA) boasts an institutional-grade expense ratio of 0.03%, making it one of the absolute lowest-cost options in the entire market. In comparison, the iShares Morningstar Small-Cap ETF (ISCB) charges a slightly higher fee of 0.04%. To put this in perspective, the pricing variance amounts to a negligible $1 per year on a $10,000 investment portfolio.
While baseline fees are roughly identical, income-focused market participants will find a more noticeable contrast in historical distributions. The iShares Morningstar Small-Cap ETF (ISCB) distributes a higher trailing-12-month dividend yield of 1.27%.
On the other hand, the Schwab U.S. Small-Cap ETF (SCHA) pays out a lower distribution yield of 1.00%. This 27-basis-point yield advantage gives a modest real-money edge to those prioritizing consistent cash flow reinvestment.
Examining Performance History and Volatility Risk
An analysis of structural risk metrics reveals how each fund navigates market turbulence. Small-cap equities are inherently prone to sharp price swings, making historical drawdown data critical for setting realistic expectations.
| Metric | Schwab U.S. Small-Cap ETF (SCHA) | iShares Morningstar Small-Cap ETF (ISCB) |
| Expense Ratio | 0.03% | 0.04% |
| Dividend Yield | 1.00% | 1.27% |
| 5-Year Beta Value | 1.26 | 1.17 |
| Maximum 5-Year Drawdown | (30.79%) | (29.93%) |
| Growth of $1,000 (5-Year Total Return) | $1,333 | $1,241 |
The risk profiles indicate that the iShares vehicle offers a marginally smoother ride. Its 5-year beta value stands at 1.17 relative to the benchmark index, and its maximum 5-year drawdown was capped at (29.93%). Meanwhile, the Schwab fund exhibited a higher beta value of 1.26 alongside a maximum drawdown of (30.79%).
Despite enduring higher short-term price volatility, the aggressive positioning of the Schwab product has historically rewarded disciplined, long-term investors.
A hypothetical investment of $1,000 mapped over a trailing 5-year period would have grown to a total return value of $1,333 within the Schwab U.S. Small-Cap ETF (SCHA). That same $1,000 allocation tracking the iShares Morningstar Small-Cap ETF (ISCB) would have generated a lower final value of $1,241.
Portfolio Architectures and Structural Sector Splits
The true driver behind these performance variations lies within the index methodologies. The iShares Morningstar Small-Cap ETF (ISCB) anchors its strategy to the Morningstar US Small Cap Extended Index, establishing a basket of 1,538 holdings.
In terms of specific sector allocations, industrials lead the charge at 18.5%, followed by technology at 16.0%, and financial services close behind at 15.6%. Top individual equity concentrations include Lumentum Holdings at 1.0%, Revolution Medicines at 0.5%, and Ati at 0.4%.
With a diverse portfolio of around 1,705 companies, the Schwab U.S. Small-Cap ETF (SCHA), which tracks the Dow Jones U.S. Small-Cap Total Stock Market Index, gives investors wide exposure to the small-cap market.
Its internal sector concentration skews heavily toward growth, dedicating 23.2% of its capital to information technology, 15.8% to industrials, and 15.1% to financial services. Its key concentrated holdings feature Sandisk at 5.3%, Lumentum Holdings at 1.29%, and Revolution Medicines at 0.65%.
Strategic Verdict for Portfolio Allocations
The choice between these two small-cap ETFs largely depends on an investor’s market outlook and risk tolerance. The Schwab ETF offers broader diversification, lower fees, and a stronger growth-oriented profile, making it attractive for investors seeking higher total return potential.
Meanwhile, the iShares ETF may appeal to more conservative investors due to its focus on industrial and infrastructure-related sectors, which can provide greater resilience during technology market downturns. Its higher cash yield may also offer additional support during periods of market weakness. Both funds provide efficient and accessible exposure to the U.S. small-cap market.