
The EUR/GBP pair is trading in a tight but increasingly bullish intraday structure, with price stabilizing just above 0.8640 and repeatedly testing the key 0.8644 resistance zone, which marks the one-week high area and the upper boundary of the current consolidation range. Vidasana Group’s brokers present a clear and insightful breakdown of this topic in the article.
Price action is contained within a well-defined 0.8620–0.8660 range, with the emergence of a consistent higher-low sequence starting from the 0.8620 base. Each dip toward support has been met with stronger buying interest, suggesting gradual accumulation pressure rather than distribution.
Volatility remains compressed, with daily ranges contracting toward recent lows, indicating that the market is in a coiling phase where directional expansion is increasingly likely once range boundaries are breached.
Macro and Flow Drivers Supporting EUR Strength
The Euro is gaining support from a broader shift toward risk-on sentiment, helped by easing geopolitical tensions and stronger demand for risk assets. Lower energy stress has pushed crude oil down toward $76–$78, its lowest in about three months.
Falling energy prices reduce Eurozone inflation pressure, especially through the HICP energy component, which has recently contributed a -0.3% to -0.6% drag on headline inflation. This improves inflation stability and lowers downside growth risk.
At the same time, the European Central Bank maintains a restrictive stance, with core inflation still sticky in the 2.6%–3.1% range, supporting expectations of higher rates for longer and a relatively firm EUR yield backdrop.
In contrast, the British Pound is limited by expectations of a more neutral Bank of England policy path, with terminal rates near 4.75%–5.00%, reducing further rate-driven upside support.
This policy divergence continues to create a structural bullish bias for EUR/GBP, especially in risk-on environments.
Technical Configuration: Compression and Early Reversal Signals
EUR/GBP is in a tight compression range between 0.8620 and 0.8644, with repeated tests of resistance while holding support firmly.
The 0.8620 level is structurally important, acting as a repeated demand zone with multiple defensive reactions and aligning with a short-term value area low, reinforcing its role as key liquidity support.
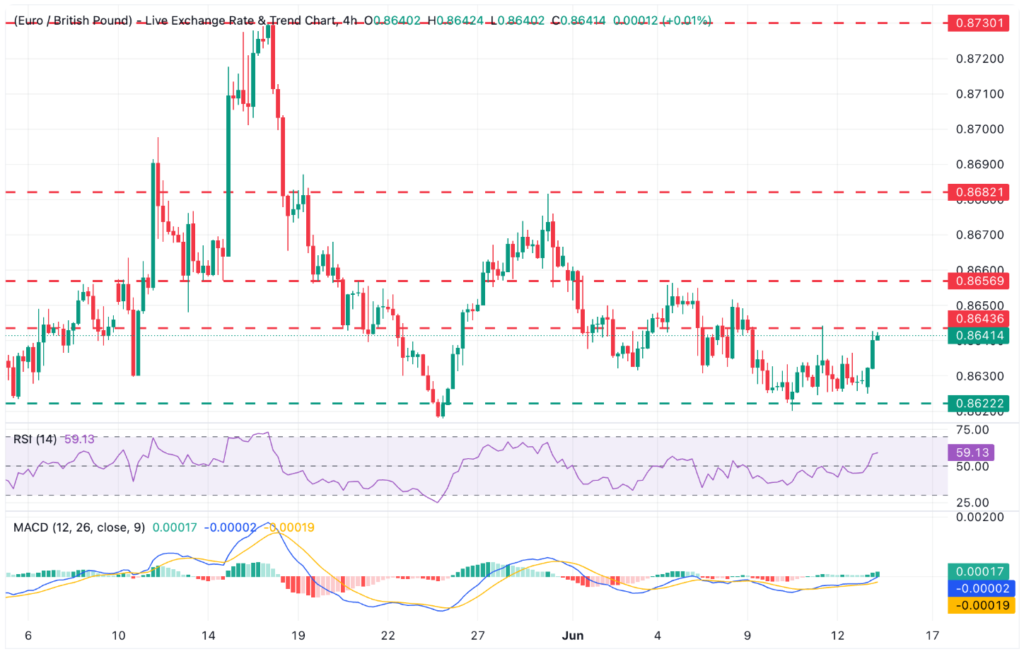
A series of higher lows (≈15–25 pips each) suggests improving bullish structure and a gradual shift in equilibrium to the upside.
Momentum is supportive: 4H RSI at 56–62 shows strengthening bullish pressure without overbought conditions, leaving room for continuation.
The MACD has turned positive, with an expanding histogram above zero and a rising signal line, indicating early bullish expansion.
Price also holds above both the 20 and 50-period MAs (4H), confirming improving trend alignment within the compression structure.
Key Levels and Liquidity Structure
Immediate resistance is at 0.8644, the upper range boundary, and a key liquidity trigger. A sustained break above it would signal a shift toward bullish continuation.
Next resistance sits at 0.8655–0.8660, a clear high-volume supply zone with repeated intraday rejections, likely attracting profit-taking and selling pressure.
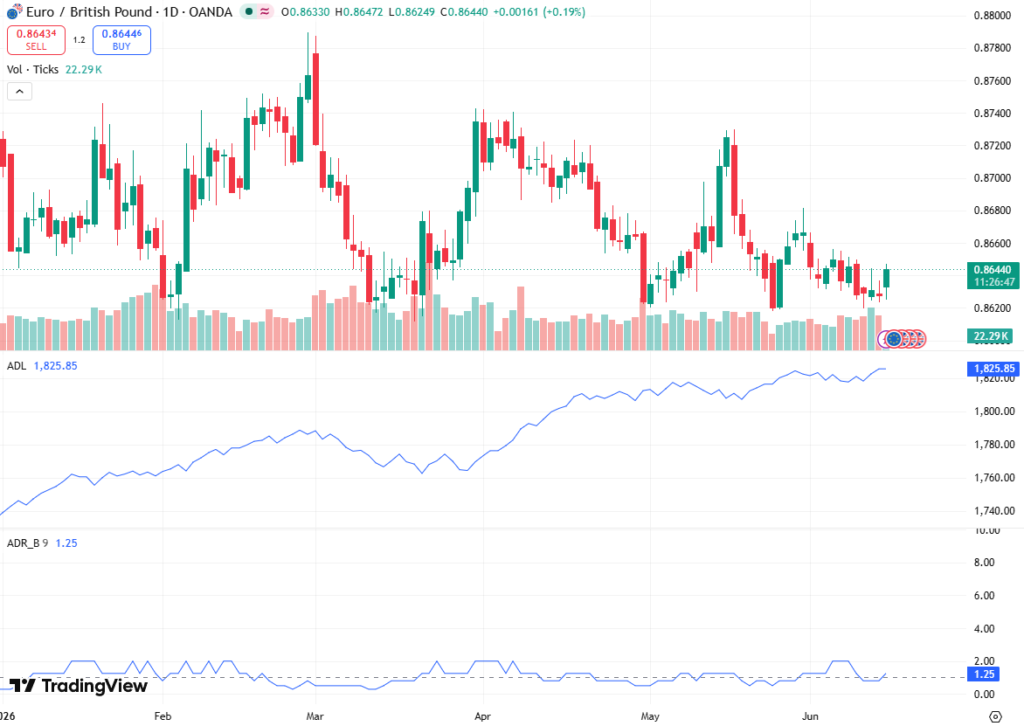
A decisive break above 0.8660 opens the path to 0.8680, the late-May swing high and upper bound of the broader consolidation structure.
On the downside, 0.8620 remains the key support/demand zone. A break below it would invalidate the higher-low structure and shift focus to 0.8612, the year-to-date low and major liquidity level.
A sustained move below 0.8612 would weaken the bullish setup and expose room for further downside extension.
Volatility and Order Flow Conditions
Implied volatility remains subdued, with expected daily ranges compressed into approximately 35–55 pips, reinforcing the idea of a market preparing for expansion.
Order flow conditions show repeated absorption near 0.8620–0.8630, while supply remains concentrated between 0.8644–0.8660. This creates a clearly defined two-tier liquidity structure, typical of pre-breakout environments.
Volume behavior suggests accumulation on dips, with buying interest consistently emerging near support, while selling pressure near resistance appears controlled rather than aggressive. This supports a constructive bias in the short term.
Outlook and Scenario Framework
The near-term outlook for EUR/GBP is defined by the ongoing battle between 0.8620 support and 0.8644 resistance. A decisive breakout above 0.8644, especially with expanding momentum and volume confirmation, would validate a bullish continuation phase targeting 0.8660 and 0.8680.
Failure to break resistance would likely extend the consolidation phase, keeping price oscillating within the established range as the market awaits additional macro or policy catalysts.
Overall, the structure is transitioning toward a bullish-leaning equilibrium, supported by improving momentum indicators, rising higher lows, and favorable macro divergence. However, confirmation remains dependent on a clean breakout above 0.8644, which is the key trigger for the next directional expansion phase.


