
The NZD/USD pair attracted strong buying interest during the Asian session on Tuesday, extending its recovery toward a nearly four-week high. Throughout this article, the brokers at Ellismis examine this topic in greater detail.
The latest upside move reflects a combination of New Zealand Dollar strength, improving technical momentum, and a temporary pause in the US Dollar rally ahead of key US economic catalysts.
The New Zealand Dollar (NZD) gained significant traction after a more hawkish policy outlook from the Reserve Bank of New Zealand (RBNZ) increased expectations that further interest rate increases could remain possible. The market reaction pushed NZD/USD higher, as traders adjusted positions in favor of the higher-yielding currency.
Meanwhile, the US Dollar (USD) entered a consolidation phase after a strong two-day advance. The greenback’s momentum slowed as traders adopted a cautious approach before the release of the latest US Consumer Price Index (CPI) data and important comments from the Federal Reserve.
Technical Structure Improves Above Fibonacci Support
From a technical perspective, NZD/USD has established a stronger bullish bias after moving above the 38.2% Fibonacci retracement level at 0.5767, measured from the May-June decline. Holding above this retracement level suggests that buyers are gradually gaining control following the previous bearish phase.
The pair is now trading closer to a critical technical resistance zone between 0.5810 and 0.5820, which represents a major confluence area. This region combines the 50% Fibonacci retracement level with the 200-day Simple Moving Average (SMA), making it a key barrier for further upside continuation.
A decisive break above the 0.5810-0.5820 resistance zone would provide a stronger technical confirmation of the recovery and could encourage additional buying momentum. However, failure to clear this area may result in short-term consolidation or a corrective pullback.
Momentum Indicators Signal Increasing Bullish Pressure
The current technical indicators are supporting the improving outlook for NZD/USD. The Moving Average Convergence Divergence (MACD) indicator has turned positive, with the MACD line crossing above the zero level, indicating that bullish momentum is strengthening.
The Relative Strength Index (RSI) is positioned around 57, reflecting positive momentum while remaining below the 70 overbought threshold. This suggests that the pair still has room for additional upside before reaching technically stretched conditions.
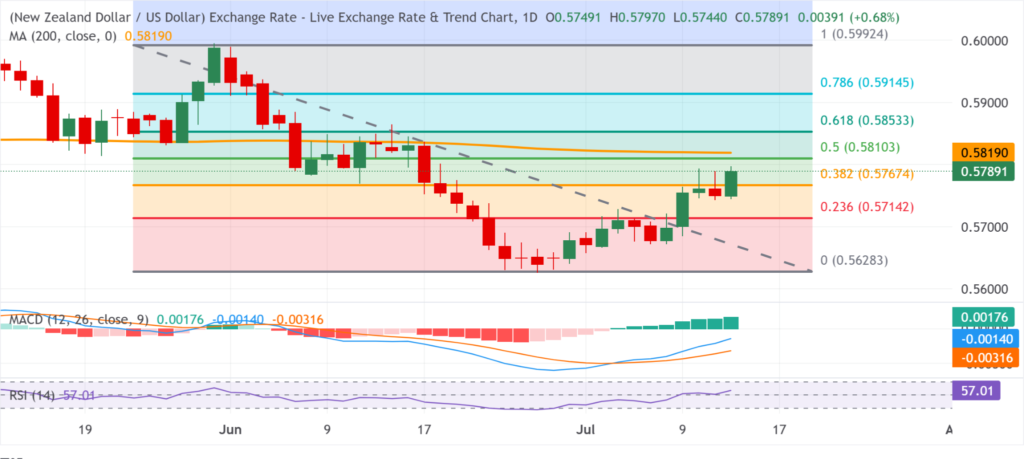
The combination of a positive MACD crossover, an improving RSI profile, and price acceptance above the 38.2% Fibonacci level indicates that buyers currently maintain the advantage. Nevertheless, confirmation above the 200-day SMA remains essential for a stronger bullish continuation signal.
Upside Targets: 0.5853, 0.5914, and 0.5992
If NZD/USD breaks above 0.5820, the next technical objective comes at the 61.8% Fibonacci retracement level near 0.5853. This level represents the next major resistance area and could determine whether the recovery develops into a broader bullish reversal.
A sustained move above 0.5853 would strengthen the positive structure and expose further upside targets at 0.5914 and 0.5992. The 0.5914 region represents an important resistance point, while the 0.5992 level could become a key medium-term target if bullish momentum continues.
The broader technical picture would improve significantly if buyers manage to push the pair toward the 0.6000 psychological barrier, as this would confirm a deeper recovery from the previous decline.
Support Levels and Downside Risks Remain Important
Despite the bullish momentum, traders should monitor key downside levels. The first important support zone remains at the 38.2% Fibonacci retracement level near 0.5767. A rejection from the 0.5810-0.5820 resistance area, followed by a break below 0.5767, would weaken the immediate bullish setup.
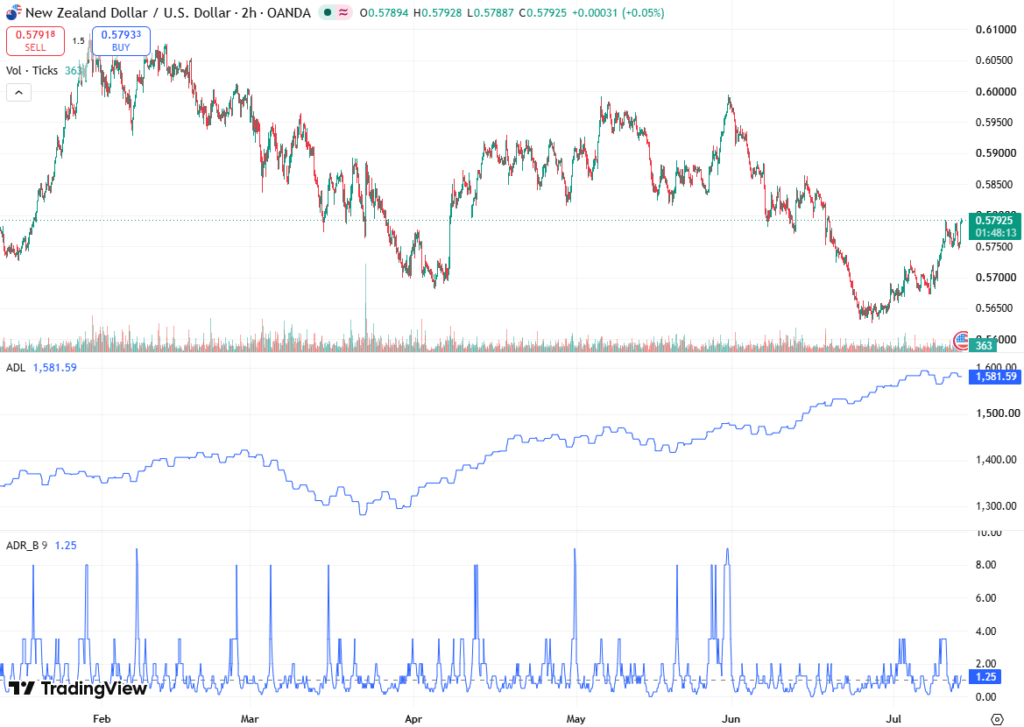
Below this level, the next support appears at the 23.6% Fibonacci retracement level around 0.5714. A move beneath 0.5714 would increase selling pressure and expose the recent swing low region near 0.5628.
The 0.5628 area represents a critical defensive zone for buyers, as a break below this level would suggest that the recent recovery phase has lost momentum and that sellers are regaining control.
NZD/USD Outlook: Breakout Above 0.5820 Is the Key Trigger
The NZD/USD forecast remains cautiously bullish as the pair benefits from RBNZ rate-hike expectations, improving technical momentum, and a weaker US Dollar ahead of major economic events.
The immediate focus remains on the 0.5810-0.5820 technical confluence zone, where the 50% Fibonacci retracement and the 200-day SMA create a significant resistance barrier. A confirmed breakout above this region could open the path toward 0.5853, followed by 0.5914 and 0.5992.
Until a clear breakout occurs, traders may continue monitoring price action around the key resistance zone, while 0.5767, 0.5714, and 0.5628 remain the major downside support levels. The next directional move will likely depend on whether bulls can convert the current momentum into a sustained break above resistance.


