
West Texas Intermediate (WTI) crude oil continues to attract aggressive buying interest, extending its recovery for the second consecutive trading session and reaching a four-week high near $80.00 per barrel during the Asian session.
The latest advance reflects a combination of strong technical momentum and renewed geopolitical supply concerns linked to potential disruptions in the Strait of Hormuz, a critical route for global energy shipments. The brokers at Ellismis delve into the details of this topic in the following article.
The WTI price recovery has gained traction after rebounding from the late-February low, with buyers pushing the commodity above several important technical barriers.
The move above the 200-day Exponential Moving Average (EMA) and the 23.6% Fibonacci retracement level of the April-July decline represents a significant shift in short-term market structure, increasing the probability of additional upside continuation.
The current technical setup favors bullish momentum, as price action remains supported above major trend indicators. The ability of WTI to sustain levels above the $77.00-$78.00 region will be crucial in determining whether the recovery develops into a broader upward move.
Geopolitical Risk Premium Supports Crude Oil Demand
The primary fundamental driver behind the recent WTI rally is the increase in Middle East supply risk. Escalating tensions involving the United States and Iran have raised concerns that disruptions around the Strait of Hormuz could affect global crude oil availability.
Reports of military actions and attacks involving regional energy infrastructure have encouraged traders to add a higher geopolitical risk premium to crude oil pricing. Since a substantial share of global oil transportation passes through the Strait of Hormuz, any threat to shipping activity can quickly influence expectations for future supply conditions.
Momentum Indicators Confirm Positive Market Structure
From a technical analysis perspective, WTI has produced a strong bullish breakout after moving above the 23.6% Fibonacci retracement level near $76.41 and the 200-day EMA around $77.24. These levels previously acted as major resistance zones and are now considered important support areas.
The Moving Average Convergence Divergence (MACD) indicator has turned firmly positive, with the MACD line crossing above the zero level, confirming improving upside momentum. This technical development suggests that buying pressure has strengthened and that sellers have lost short-term control.
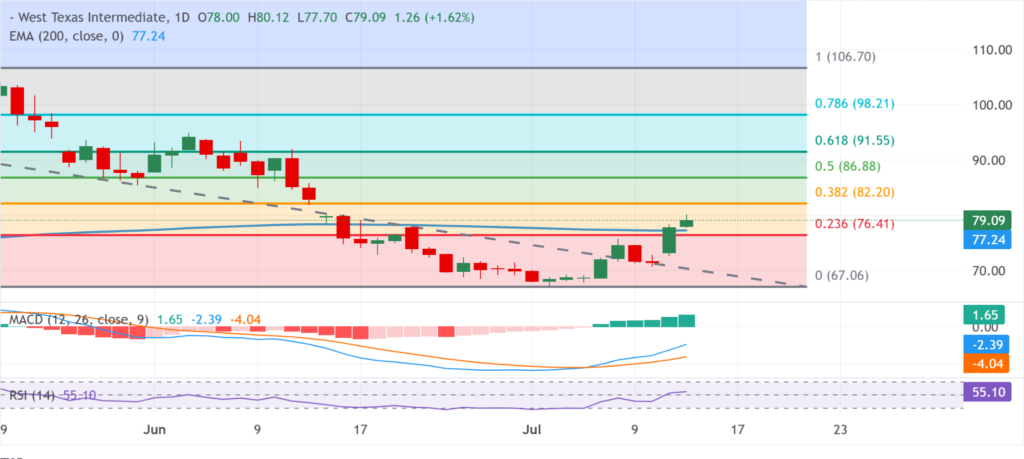
The Relative Strength Index (RSI) is positioned at 55.10, indicating positive momentum without excessive overbought conditions. An RSI reading above 50 generally supports a bullish bias, while the current level leaves room for additional gains before the market reaches a more stretched condition.
The combination of a positive MACD signal, an RSI above 50, and a successful breakout above the 200-day EMA creates a constructive technical environment for further WTI appreciation.
WTI Resistance Levels and Upside Targets
The immediate upside barrier for WTI crude oil is located at the 38.2% Fibonacci retracement level near $82.20. A confirmed daily close above this resistance zone could strengthen the bullish trend and expose higher technical targets.
The next resistance levels are positioned at the 50% Fibonacci retracement level near $86.88 and the 61.8% Fibonacci retracement level around $91.55. These Fibonacci zones represent potential profit-taking areas where additional selling pressure could emerge.
A move toward the $86.88-$91.55 range would require continued support from both fundamental and technical factors, including persistent supply concerns, strong momentum indicators, and sustained demand from speculative buyers.
Downside Levels to Monitor During Corrections
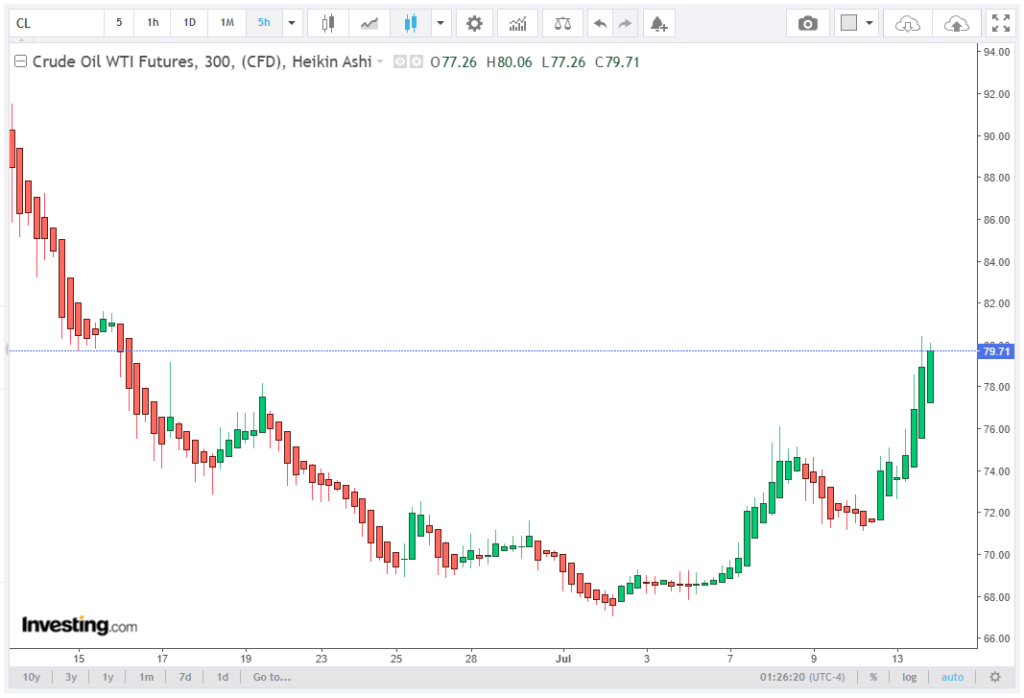
Despite the bullish structure, short-term pullbacks remain possible following the rapid move toward $80.00 per barrel. A corrective decline would not necessarily invalidate the recovery trend if key technical support levels continue to hold.
The first major support zone is located around the 200-day EMA at $77.24, followed by the 23.6% Fibonacci retracement level at $76.41. These areas are expected to attract renewed buying interest if WTI experiences profit-taking pressure.
A deeper correction below these levels would weaken the immediate bullish outlook and could expose the next significant support region near $67.06, which represents a broader structural floor from previous price action.
WTI Forecast: Buyers Maintain Control Above $77.00
The current WTI price forecast remains bullish, with the commodity benefiting from a combination of technical breakout signals and supply-side uncertainty. The advance toward $80.00 per barrel confirms that buyers have regained short-term control after the previous decline.
As long as WTI remains above the 200-day EMA at $77.24 and the 23.6% Fibonacci level at $76.41, corrective moves are likely to be viewed as potential buying opportunities. A break above $82.20 would strengthen the bullish scenario and potentially open the way toward $86.88 and $91.55.
For now, the technical structure favors further upside, although volatility is expected to remain elevated as markets continue to evaluate the impact of Middle East tensions, global supply risks, and upcoming macroeconomic catalysts.


