
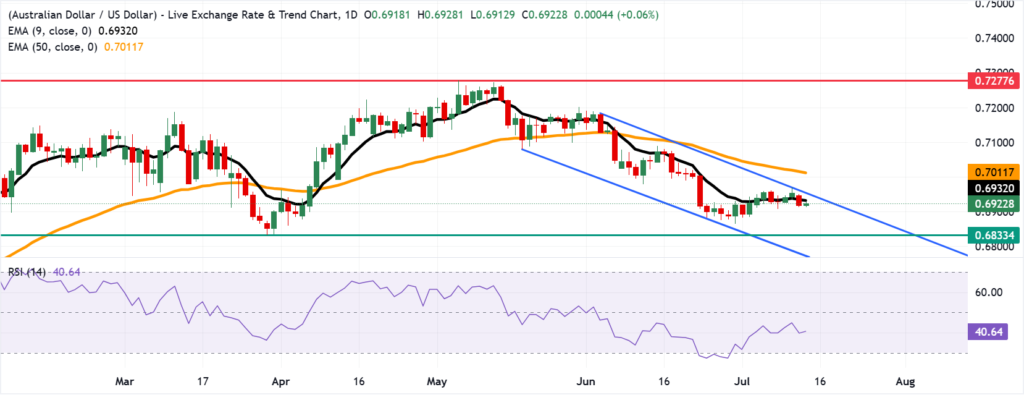
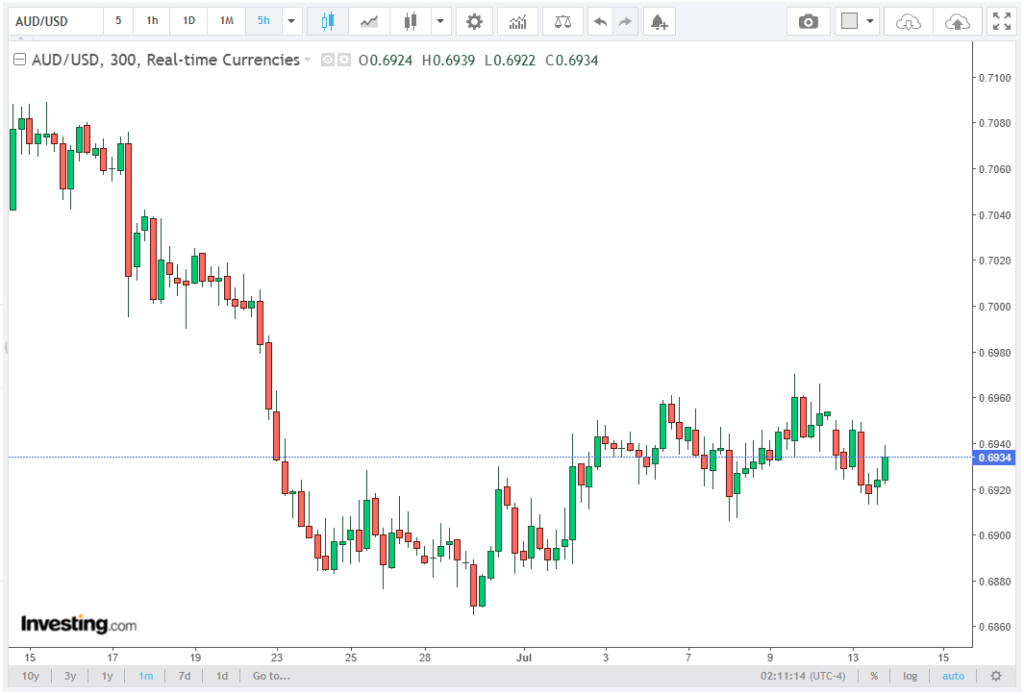
The AUD/USD pair is stabilizing after a 0.5% decline, trading near 0.6930 in Asian hours. Despite an intraday recovery, the daily chart remains bearish, with the pair staying within a well-established descending channel, signaling continued pressure from sellers.
This article features the brokers at Ellismis sharing their insights and in-depth analysis of this topic.
The rebound remains corrective, with the price below key resistance levels. Trading under the nine-day and 50-day EMAs keeps bearish alignment intact, signaling continued negative momentum and downside pressure for now.
The immediate technical focus is centered on the 0.6932–0.6960 resistance zone. A failure to break above this area would keep the downside structure intact, while a confirmed breakout could signal a shift toward a more neutral or bullish technical setup.
EMA Resistance Keeps Downside Pressure Intact
The nine-day EMA at 0.6932 is currently acting as the first short-term resistance barrier for AUD/USD. The pair’s ability to trade above this level will be important for determining whether buyers can extend the current recovery.
However, the broader trend remains negative because AUD/USD is still positioned below the 50-day EMA at 0.7011. The distance between current price levels near 0.6930 and the 0.7011 resistance zone highlights that buyers still need to overcome multiple technical obstacles before confirming a meaningful reversal.
The current EMA structure remains bearish, with the shorter-term moving average below medium-term resistance levels. This configuration typically indicates that rallies may attract selling pressure unless price action confirms a sustained breakout.
A daily close above 0.6960, the upper boundary of the descending channel, would provide the first technical indication that bearish momentum is weakening. Above this level, the next upside target would be the 50-day EMA at 0.7011, followed by potential resistance near the 0.7050 psychological area.
RSI Momentum Indicator Confirms Bearish Market Conditions
The 14-day Relative Strength Index (RSI) is currently positioned around 40, confirming that AUD/USD remains under bearish momentum pressure. The RSI has moved away from extreme oversold conditions but remains below the neutral 50 level, indicating that buying strength is still limited.
A reading near 40 suggests that sellers maintain control, although the pair is not yet in deeply oversold territory. If RSI declines toward the 30 threshold, it would indicate increasing downside momentum and could support another move lower toward key support levels.
For a stronger bullish confirmation, the RSI would need to recover above 50, followed by movement toward the 60–70 zone, which would indicate stronger buying momentum. Until this occurs, technical indicators continue to favor a cautious bearish outlook.
Downside Targets: 0.6833 Support and 0.6770 Channel Floor
The primary downside target remains the 0.6833 level, which represents the nearly six-month low recorded on March 30. This level is the first major support zone that bears are likely to test if the current recovery fails.
A rejection from the 0.6932–0.6960 resistance area could trigger renewed selling pressure, pushing AUD/USD back toward 0.6900, followed by the 0.6833 support region.
A decisive break below 0.6833 would confirm a continuation of the bearish trend and expose the pair to the next technical target at the lower boundary of the descending channel near 0.6770.
The 0.6770 level represents a critical long-term support area because it aligns with the lower edge of the current channel formation. A move toward this zone would indicate that sellers remain firmly in control and that the broader downtrend is continuing.
Bullish Breakout Scenario: 0.6960 and 0.7011 in Focus
The bullish scenario requires AUD/USD to first reclaim the 0.6932 nine-day EMA and then break above the 0.6960 descending channel resistance. A successful breakout above this region would invalidate the immediate bearish continuation pattern and improve short-term market sentiment.
If buyers gain control above 0.6960, momentum could accelerate toward the 50-day EMA at 0.7011. A move above 0.7011 would represent a more significant technical improvement and could expose the pair to higher resistance levels around 0.7050 and 0.7100.
AUD/USD Forecast: Bearish Bias Below 0.6960 Resistance
The AUD/USD technical forecast remains bearish while price trades below the 0.6960 breakout level and the 50-day EMA at 0.7011. The combination of a descending channel pattern, RSI near 40, and negative EMA positioning indicates that sellers continue to hold the technical advantage.
The short-term price direction will depend on whether buyers can establish a breakout above the 0.6932–0.6960 resistance zone or whether sellers push the pair toward 0.6833 and potentially 0.6770.
As long as AUD/USD remains below key resistance levels, the probability favors continued downside pressure, with any recovery attempts likely representing temporary corrections within the prevailing bearish trend.


