
The USD/JPY pair remains under mild selling pressure, trading near 162.20 during the European session on Wednesday, as the US Dollar (USD) loses momentum following a decline in expectations for additional Federal Reserve (Fed) interest rate hikes.
The pair’s movement reflects a market environment dominated by inflation trends, central bank policy expectations, and a narrowing range of price action. Drexeldev explores the topic in depth, with a detailed discussion throughout the article below.
The US Dollar Index (DXY) is trading around 100.78, down 0.16%, as investors reduce exposure to the Greenback after the latest US Consumer Price Index (CPI) data showed further moderation in inflation. The weaker inflation figures have increased expectations that the Fed’s tightening cycle may be approaching its final phase.
The June CPI report showed that headline inflation eased to 3.5% YoY, while core CPI declined to 2.6% YoY. The continued slowdown in price pressures has reduced demand for aggressive monetary policy expectations, creating additional downside pressure on the USD.
Fed Policy Outlook Keeps USD Volatility Elevated
Although inflation has moderated, Federal Reserve officials continue to emphasize the importance of maintaining restrictive policy until inflation moves sustainably toward the 2% target. The central bank’s focus on price stability remains a key driver for financial markets, with traders closely monitoring incoming economic data for signals about future rate decisions.
The latest inflation figures have pushed markets to reassess the probability of further Fed rate increases in 2026, limiting upside momentum in US Treasury yields and weakening the broader Dollar trend. However, persistent inflation risks could prevent a rapid shift toward a significantly more accommodative policy outlook.
BoJ Rate Outlook Provides Support for Japanese Yen
On the Japanese side, traders are watching upcoming signals from the Bank of Japan (BoJ) regarding potential additional interest rate adjustments. The possibility of further policy normalization continues to provide underlying support for the Japanese Yen (JPY).
A stronger Yen scenario could develop if the BoJ adopts a more hawkish stance, particularly if domestic inflation and wage growth continue improving. At the same time, the wide interest rate gap between Japan and the United States remains a major factor limiting aggressive Yen appreciation.
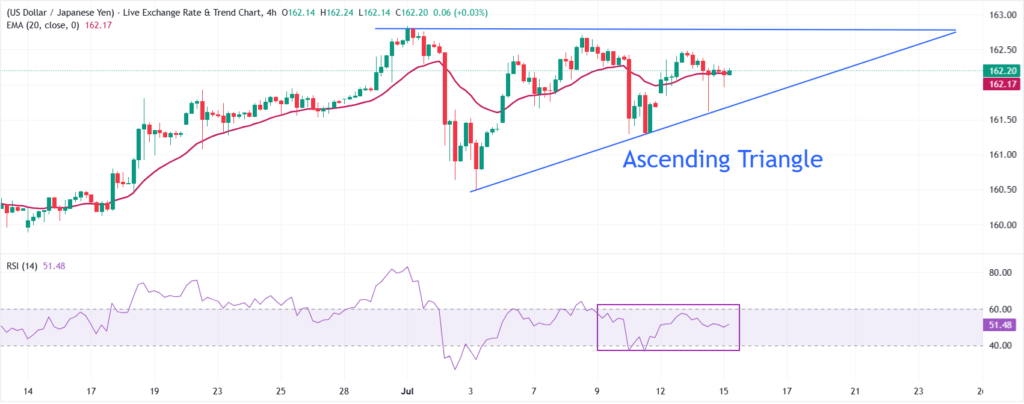
USD/JPY Technical Analysis: Ascending Triangle Indicates Volatility Compression
From a technical perspective, USD/JPY is consolidating near 162.20, with price action remaining close to the 20-period Exponential Moving Average (EMA) at 162.10. The proximity between the current price and the EMA indicates a neutral short-term trend, with momentum lacking a clear directional bias.
The formation of an Ascending Triangle pattern highlights a period of volatility contraction. This structure typically develops when buyers gradually establish higher support levels while sellers defend a fixed resistance zone. A confirmed breakout from this pattern could trigger the next significant move.
The Relative Strength Index (RSI) is positioned at 51.51, reflecting neutral-to-positive momentum. The indicator remains above the 50 level, suggesting that buyers maintain a slight advantage, but the absence of overbought conditions leaves room for further upside movement.
Key USD/JPY Resistance and Support Levels
The primary upside barrier is located near the descending trend line at 162.79. A sustained break above this resistance level would strengthen the bullish technical outlook and could expose the pair to further gains as traders react to a confirmed triangle breakout.
A move above 162.79 would indicate that buyers have regained control and could shift market focus toward higher resistance zones. However, failure to break this level would keep the pair trapped within the current consolidation range.
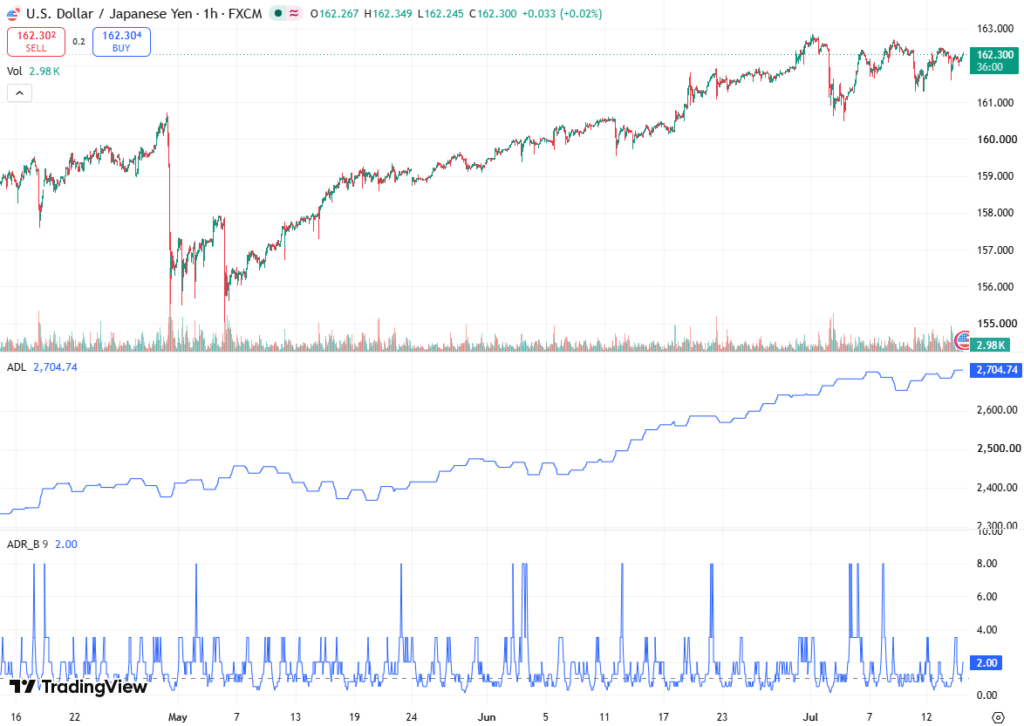
On the downside, initial support is located near the rising trend-line support around 161.79. A decisive decline below this level would weaken the current structure and increase selling pressure.
If USD/JPY breaks below 161.79, the next major downside target is located near the July 3 low at 160.50. A move toward this region would signal a broader bearish correction and confirm that sellers are gaining control.
USD/JPY Outlook: Breakout Potential Builds Around 162.00 Region
The USD/JPY market structure suggests that a larger directional move may be approaching as volatility continues to compress inside the Ascending Triangle formation. The pair is currently positioned between critical technical levels, with 162.79 resistance and 161.79 support defining the immediate trading range.
A bullish breakout above 162.79 could revive upward momentum, while a bearish breakdown below 161.79 may accelerate losses toward 160.50. Until either level is breached, the pair is likely to remain influenced by shifts in Fed expectations, BoJ policy signals, and upcoming US economic indicators.
The current technical setup reflects a market preparing for expansion after a period of reduced volatility, making the next breakout direction crucial for the medium-term USD/JPY trend.


