
The EUR/USD pair extends its recovery for a second consecutive session, trading with a mild bullish bias as the US Dollar weakens across the broader market. The pair is currently hovering around the 1.1435–1.1440 zone during the Asian session, recovering after the previous rejection from the 1.1460–1.1470 resistance area.
Throughout the article below, the specialists at Drexeldev examine this topic in more detail.
Despite the short-term improvement, the technical structure remains neutral-to-cautious, as EUR/USD continues to trade inside a multi-week consolidation range. The pair has failed to secure a decisive breakout above the 23.6% Fibonacci retracement level of the April–June decline, keeping buyers from establishing a stronger upward trend.
The immediate technical focus remains on the 1.1470 resistance hurdle, where sellers have repeatedly defended the upside. A sustained move above this region would be required to confirm a continuation of the recovery from the 1.1325 June low.
Fundamental Drivers: USD Weakness Supports EUR/USD Recovery
The recent EUR/USD rebound has been supported by renewed US Dollar selling pressure following weaker-than-expected US inflation data. The softer inflation reading reduced expectations for aggressive Federal Reserve tightening, leading markets to adjust future interest-rate projections.
Lower expectations for additional rate increases have weakened demand for the USD, providing a temporary boost for the Euro. However, the downside in the dollar remains limited due to persistent inflation risks, elevated crude oil prices, and continued focus on central bank price stability policies.
At the same time, rising geopolitical tensions have increased demand for traditional safe-haven assets, preventing a sharper decline in the USD. This combination of dollar weakness and risk aversion has created a mixed environment for EUR/USD traders.
Momentum Indicators Signal Recovery, Not a Confirmed Trend Reversal
From a technical perspective, EUR/USD shows signs of improving momentum, but current indicators do not yet confirm a major bullish reversal. The MACD indicator on the short-term chart has turned positive, suggesting increasing upside momentum and improving buyer participation.
The Relative Strength Index (RSI) is positioned near 56, indicating moderate bullish momentum while remaining below overbought territory. The indicator supports further corrective gains but does not signal excessive buying pressure.
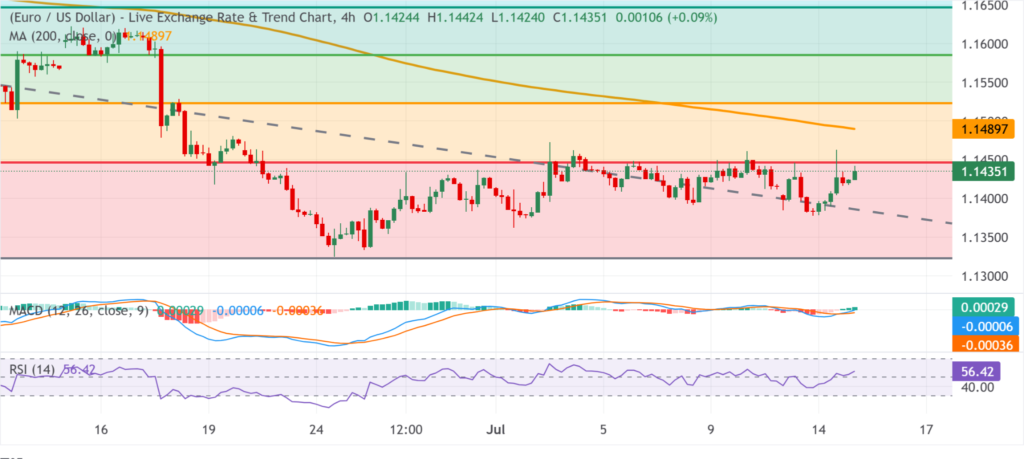
The pair’s inability to break above the 23.6% Fibonacci retracement near 1.1470 remains the main technical limitation. Until buyers achieve a clear breakout, the recent move higher is likely to be viewed as a corrective recovery rather than the beginning of a sustained uptrend.
Key Resistance Levels: 1.1470, 1.1490, and 1.1523 in Focus
The first major resistance zone for EUR/USD remains between 1.1460 and 1.1470, aligned with the 23.6% Fibonacci retracement level from the April–June decline. A confirmed daily close above this region could strengthen bullish momentum and expose higher targets.
The next important resistance appears near the 1.1490 area, where the 200-period Simple Moving Average (SMA) on the 4-hour chart is located. This technical indicator represents a significant dynamic resistance level and could determine whether the recovery develops into a stronger bullish move.
A successful break above 1.1490 would shift attention toward the next Fibonacci barriers. The 38.2% Fibonacci retracement level near 1.1523 represents the next upside target, followed by the 50.0% Fibonacci retracement level around 1.1585.
A move toward 1.1585 would indicate that buyers have regained stronger control and would improve the medium-term technical outlook for the Euro.
EUR/USD Support Levels: 1.1325 Remains Critical
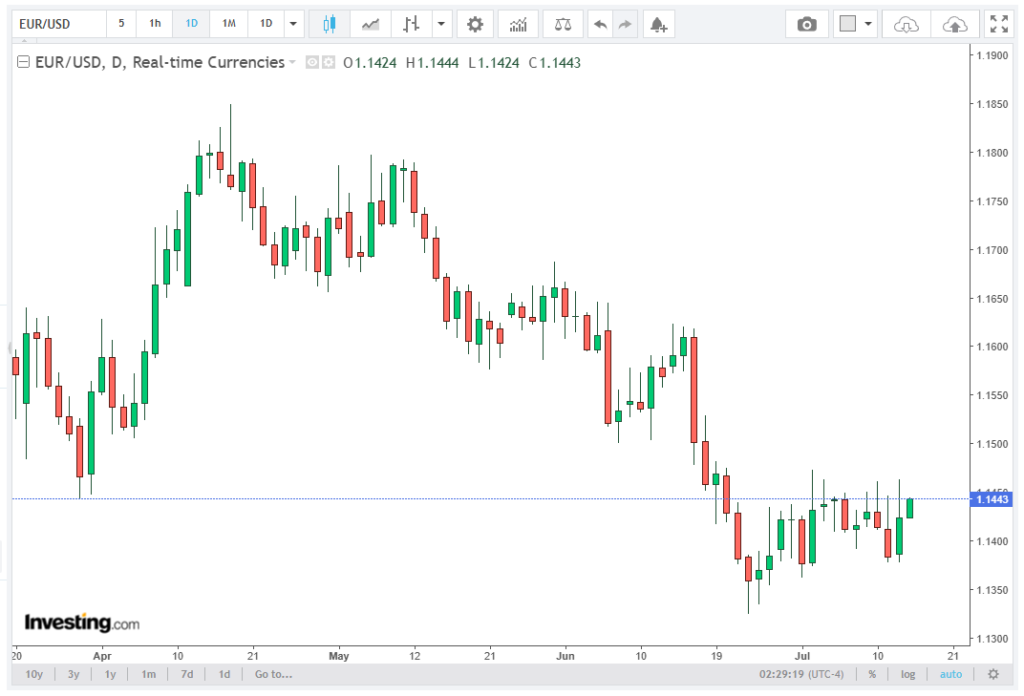
On the downside, the main structural support remains located near the 1.1323–1.1325 region, corresponding with the recent year-to-date low reached in June. This zone represents a major technical floor for the pair.
A decisive break below 1.1323 would invalidate the current recovery attempt and strengthen the broader bearish trend structure. Such a move could increase selling pressure and expose EUR/USD to additional downside levels.
Above this support, the 1.1400 psychological level remains an important short-term pivot. Holding above this area would allow buyers to continue challenging resistance levels, while a drop below it could signal renewed weakness.
EUR/USD Forecast: Cautious Bullish Outlook Below 1.1470
The current EUR/USD forecast remains cautiously bullish in the short term, supported by improving momentum indicators and a softer US Dollar environment. However, buyers continue to face significant technical obstacles below the 23.6% Fibonacci level and the 1.1470 resistance zone.
The pair requires a confirmed breakout above 1.1470–1.1490 to establish stronger bullish momentum toward 1.1523 and 1.1585. Until that confirmation occurs, the upside remains vulnerable to renewed selling pressure.
With MACD improving, RSI near 56, and price action holding above key support, EUR/USD maintains recovery potential. However, persistent geopolitical risks, inflation uncertainty, and resistance near major technical levels suggest that traders should remain cautious before positioning for an extended bullish move.


