
West Texas Intermediate (WTI) extends its consolidation during Wednesday’s Asian session, fluctuating around $79.00 after reaching a one-month high near $79.70 on Tuesday. The recent pause follows a strong recovery from July lows and reflects a temporary balance between buyers and sellers rather than a deterioration in the prevailing trend.
The team at Drexeldev explores this topic in greater detail throughout the article below.
Price action remains technically constructive after WTI decisively reclaimed the 23.6% Fibonacci retracement of the April-July decline at $76.58 and moved above the 200-day Exponential Moving Average (EMA) at $77.23. Holding above these technical thresholds reinforces the view that the medium-term trend is shifting back in favor of buyers.
The market continues to monitor developments in the Middle East, where elevated geopolitical risks and concerns over global supply disruptions are maintaining a significant risk premium across the energy complex.
Geopolitical Risk Premium Continues to Support Crude Oil
Fundamental conditions remain supportive for Crude Oil as military activity between the United States and Iran continues to intensify. Additional airstrikes and retaliatory attacks have increased uncertainty regarding regional stability, while warnings of further military action continue to elevate market risk.
The ongoing closure of the Strait of Hormuz remains one of the most important bullish drivers. The waterway transports approximately 20% of global petroleum liquids and roughly 17 million to 20 million barrels per day, making it one of the world’s most strategically significant energy corridors.
Any prolonged disruption raises the probability of tighter physical supplies and higher transportation costs, both of which support higher crude prices.
Break Above the 200-Day EMA Confirms Improving Technical Structure
From a technical perspective, the recent breakout carries significant importance. The advance above the 200-day EMA at $77.23 confirms a notable improvement in the long-term trend. At the same time, the recovery through the 23.6% Fibonacci retracement at $76.58 validates the transition from corrective trading toward a developing bullish phase.
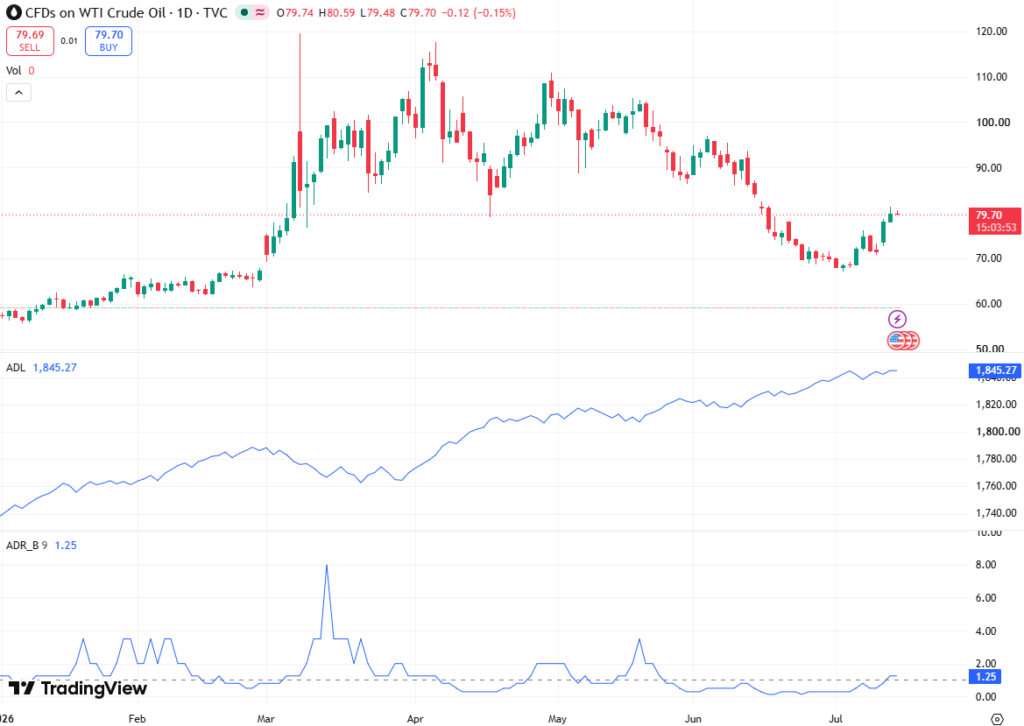
The recovery has also produced a sequence of higher highs and higher lows, reinforcing the current upward market structure. Following several unsuccessful attempts to overcome long-term resistance during previous weeks, buyers have now established control over both dynamic and static resistance zones.
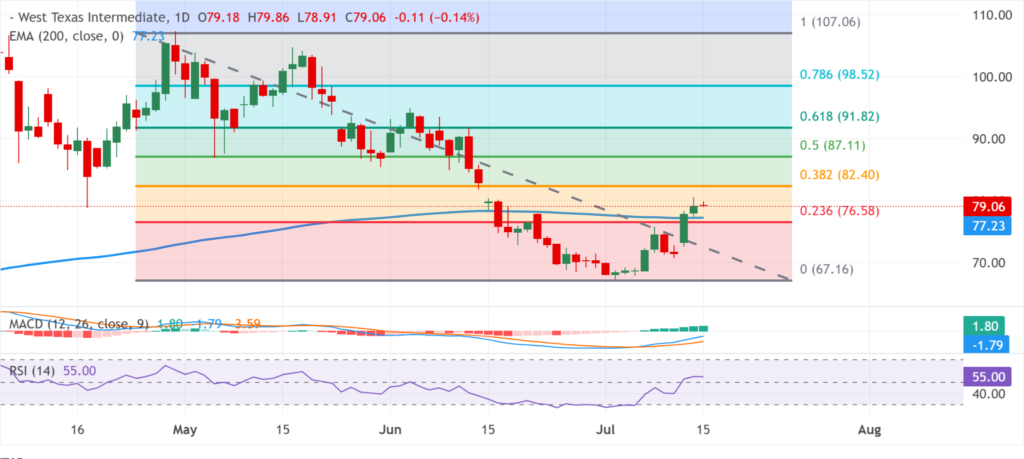
The Relative Strength Index (RSI) is currently near 55.00, remaining above the neutral 50 threshold yet comfortably below the 70 overbought level. This configuration indicates strengthening bullish momentum without signaling excessive market conditions.
Meanwhile, the Moving Average Convergence Divergence (MACD) remains above the zero line, with the MACD line maintaining separation above the signal line and histogram bars continuing to expand into positive territory. This combination typically reflects accelerating upside momentum and supports expectations for additional gains.
Fibonacci Levels Define the Next Upside Targets
Immediate resistance is located at the 38.2% Fibonacci retracement near $82.40. A decisive daily close above this level would confirm a continuation of the current recovery and expose the next major resistance at the 50.0% Fibonacci retracement around $87.11.
Beyond that level, the 61.8% Fibonacci retracement at $91.82 becomes the next medium-term upside objective. This level represents one of the most closely monitored Fibonacci ratios and frequently acts as a major reversal or continuation zone during trending markets.
A sustained move above $82.40 would also increase the probability of additional momentum buying, particularly if geopolitical developments continue to tighten global supply expectations.
Key Support Levels Remain Intact
On the downside, the first technical support remains the 200-day EMA at $77.23, which now serves as the primary dynamic support following this week’s breakout. Maintaining price action above this moving average would preserve the current bullish structure.
The next support is the 23.6% Fibonacci retracement at $76.58, where renewed buying interest may emerge should short-term profit-taking trigger a corrective pullback.
Below these levels, the broader structural support remains at $67.16, representing the primary swing low from the recent decline. Although considerably below current prices, this level continues to define the long-term bullish framework.
As long as WTI trades above $76.58 and the 200-day EMA, technical conditions continue to favor buyers.
Technical Outlook
The overall technical picture remains increasingly bullish as WTI consolidates above $79.00 while holding firmly above both the 200-day EMA and the 23.6% Fibonacci retracement. Positive readings from the RSI, expanding MACD momentum, and the formation of higher highs and higher lows all point toward strengthening upside pressure.
If buyers successfully clear $82.40, attention is likely to shift toward $87.11, followed by the 61.8% Fibonacci retracement at $91.82. Conversely, sustained trading below $77.23 would weaken immediate bullish momentum and expose $76.58 as the next critical support.
For now, the combination of constructive technical signals, elevated geopolitical risk, and continued support above major long-term trend indicators suggests that WTI remains positioned for further near-term appreciation.


