
Silver moved sharply higher on Tuesday as easing oil prices reduced some of the inflation pressure that had unsettled financial markets. Spot silver climbed around 2.8% to $57.99 per ounce, outperforming gold and moving back toward the psychological $58 level.
This analysis from mlgoldcorp.com examines whether silver can maintain the advance and challenge $60, or whether the rebound is vulnerable to profit-taking after its rapid move.
Buyers Return After a Volatile Period
Silver has experienced wide price swings in recent weeks. The latest recovery has improved the short-term chart, with the price moving above areas that previously limited several rebound attempts.
The 20-day Exponential Moving Average is the first indicator to watch. Continued trading above it would suggest the rise is developing into more than a brief reaction.
The 50-day EMA gives a broader view. If the shorter average remains above the longer one, the wider structure should continue to favor buyers.
Even so, silver often moves faster than gold in both directions. A strong session can quickly be followed by consolidation near a major round number.
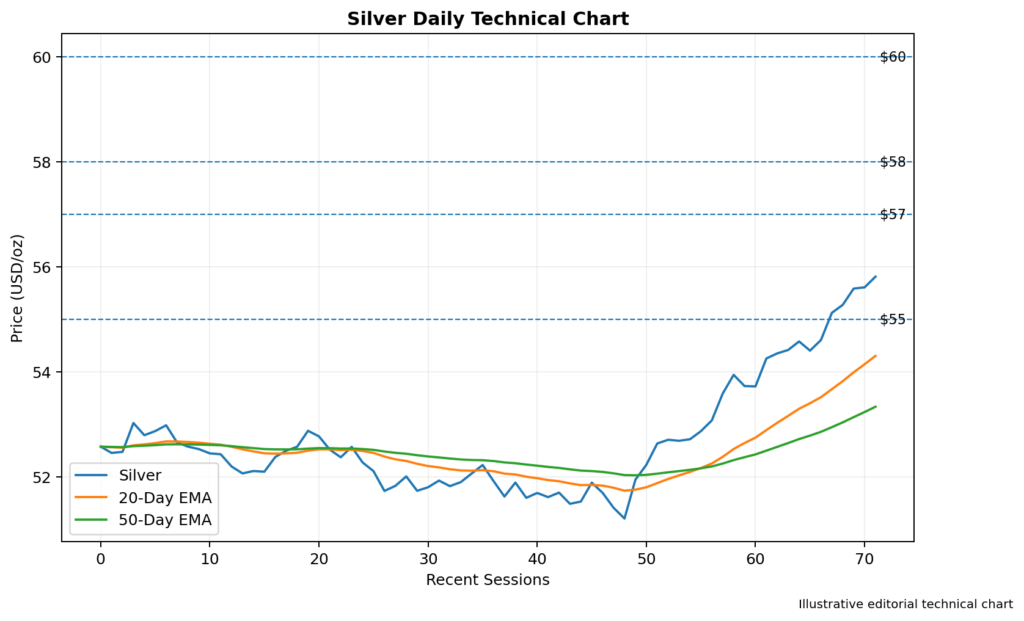
Image 1: Silver Daily Chart With the 20-Day and 50-Day EMAs, Support at $55 and Resistance Near $58
RSI Is Moving Toward Overbought Territory
The 14-day Relative Strength Index has climbed alongside the latest advance.
A reading above 50 confirms that buying momentum is stronger than selling pressure. If RSI moves through 70, silver would enter overbought territory.
That would not automatically end the rally, but the risk of sudden profit-taking would increase.
Traders may also watch for divergence. If silver reaches a higher price while RSI forms a lower peak, the move may be losing strength.
Resistance Builds Around $58
The first major barrier is positioned near $58. Silver recently traded just below this level, making it the immediate test for buyers.
A confirmed daily close above $58 could open the way toward $59, followed by the psychological $60 level.
The $60 area may attract selling because round numbers often act as profit-taking zones. If silver clears it with strong momentum, the next target could appear around $62.
The main resistance levels are $58, $59, $60, and $62.
Support Could Appear Near $55
Immediate support is located around $57, close to the latest breakout area.
A pullback beneath $57 could bring $55 into focus. This level may align with the short-term moving averages and earlier consolidation.
Further weakness could expose approximately $53.50, followed by $52.
A daily close below $52 would weaken the bullish structure and suggest the latest rally has failed to hold.
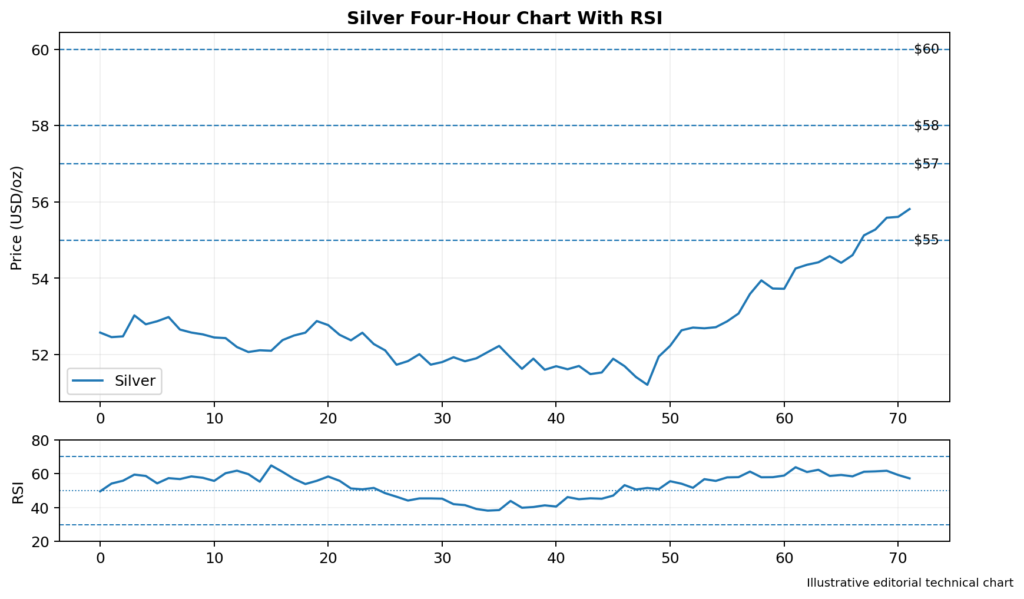
Image 2: Silver Four-Hour Chart With RSI, Support at $57 and $55, and Resistance at $58 and $60
Oil Prices Changed the Market Mood
Silver’s rise followed a retreat in crude oil prices as investors responded to renewed hopes for diplomatic progress in the Middle East.
Brent crude eased to around $88.56 per barrel, down from its recent one-month high. The decline helped calm concerns that energy costs would create another wave of inflation.
Lower oil prices can support precious metals by reducing the risk that central banks will need to raise interest rates aggressively.
That matters because silver does not pay interest. Lower expected rates make non-yielding assets more attractive compared with bonds and cash.
Rate Expectations Remain Mixed
Markets still see only a limited chance of an interest-rate increase at the next US policy meeting, but expectations for a possible September move have risen.
Traders recently placed the probability of a September increase at approximately 64%.
Higher rates could limit silver’s upside by supporting bond yields and the dollar. A continued decline in oil prices may reduce those expectations again.
Silver may therefore remain sensitive to energy markets, inflation data, and Treasury yields.
Industrial Demand Adds Another Layer
Silver differs from gold because it is also widely used in electronics, solar panels, electric vehicles, and advanced manufacturing.
The recent rebound in Asian technology shares may provide an additional positive signal. South Korea’s KOSPI rose around 4.5%, while Japan’s Nikkei gained nearly 3% as oil prices eased and risk appetite recovered.
However, concerns about technology valuations remain. A renewed equity selloff could weaken expectations for industrial demand even while supporting silver’s defensive appeal.
Trading Implications
Silver keeps a bullish short-term bias while trading above $55 and its main moving averages.
A confirmed break above $58 could expose $59 and $60. Stronger RSI readings would support that scenario, although overbought conditions may increase volatility.
A retreat below $57 would shift attention toward $55. A sustained break beneath $55 could bring $53.50 back into view.
Conclusion
Silver has returned to the $58 area as softer oil prices and improved sentiment support precious metals.
Resistance is positioned at $58, $59, $60, and $62. Support can be found near $57, $55, $53.50, and $52.
The chart currently favors buyers, but the reaction around $58 should show whether the rally can continue toward $60 or needs a period of consolidation first.


