
Ethereum (ETH) recorded a sharp recovery after gaining 5% in 24 hours, breaking above the critical $1,800 resistance zone following weaker-than-expected U.S. inflation data. The latest Consumer Price Index (CPI) report showed annual inflation slowing to 3.5% in June, which was 30 basis points below market expectations.
The article below features Drexeldev‘s expert perspective on this topic, covering the key points in detail.
The monthly inflation figure also surprised markets, with consumer prices declining by 0.4% month-over-month compared with economists’ forecast of a 0.1% decrease. More importantly for financial markets, core CPI inflation dropped by 20 basis points, excluding volatile energy prices and indicating that underlying price pressures are easing.
The combination of lower inflation and slowing price growth has increased expectations that the Federal Reserve could maintain a less restrictive monetary policy. This shift has supported demand for risk assets, including cryptocurrencies, as investors anticipate improved liquidity conditions.
For Ethereum, the inflation-driven rally arrived at a technically important point. The move above $1,800 broke a major resistance level that had limited upside momentum and triggered a wave of forced buying from traders holding bearish positions.
ETH Short Liquidations Accelerate After Breakout
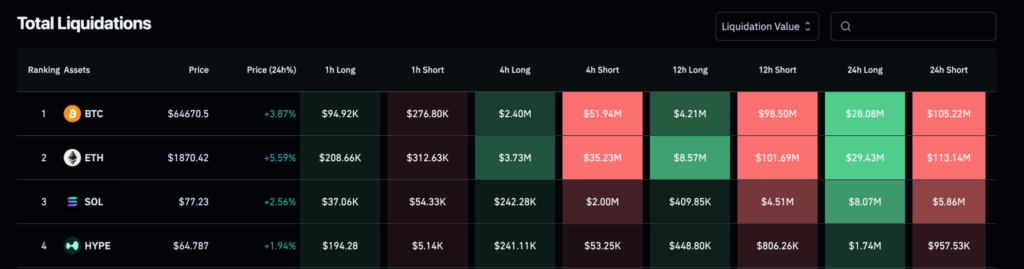
Ethereum’s breakout above $1,800 triggered major volatility across the derivatives market. CoinGlass data showed nearly $300 million in crypto short positions were liquidated within 24 hours after the surge.
Ethereum accounted for over one-third of total short liquidations, briefly surpassing Bitcoin in liquidation volume. The event suggests many traders were positioned for further ETH declines before the breakout. The resulting short squeeze added upward pressure as traders were forced to buy back positions.
The move also highlighted the technical importance of the $1,800 level, where concentrated short positions were removed, reducing selling pressure and supporting further momentum.
Ethereum Technical Analysis Shows Bullish Reversal Structure
From a technical perspective, Ethereum has developed a potentially bullish reversal pattern after establishing a strong support base around $1,550. The asset formed a double bottom pattern, which occurs when the price tests a support zone twice before reversing higher.
The first major confirmation of this pattern came with the break above the $1,800 neckline resistance. A successful move beyond this level increases the probability that ETH has completed its previous bearish structure and entered a recovery phase.
Additional confirmation comes from the daily Relative Strength Index (RSI), which displayed a bullish divergence. While Ethereum’s price was declining, the RSI showed improving momentum, indicating that selling pressure was weakening.
The RSI divergence suggests that bearish momentum has slowed, although it does not represent a standalone buy signal. Instead, it provides evidence that market conditions are becoming more favorable for a potential trend reversal.
Trading volume also supports the bullish scenario. Ethereum’s daily trading volume increased by approximately 33%, showing stronger market participation during the breakout. Higher volume during a resistance breakout typically improves the reliability of the move because it indicates broader investor involvement.
The 200-Day EMA Is Ethereum’s Critical Resistance Level
Despite the recent rally, Ethereum faces its most important technical challenge near the 200-day exponential moving average (EMA). This indicator currently sits around the $2,200 price zone and represents a key measure of Ethereum’s long-term trend direction.
The 200-day EMA is closely monitored by institutional traders because sustained movement above this level often signals a transition from a bearish market structure to a bullish trend.
If Ethereum reaches $2,200 and breaks above the 200-day EMA, the next major resistance target would likely be positioned around $2,400. A successful breakout above this level could confirm a larger recovery cycle and potentially mark the end of the previous bearish phase.
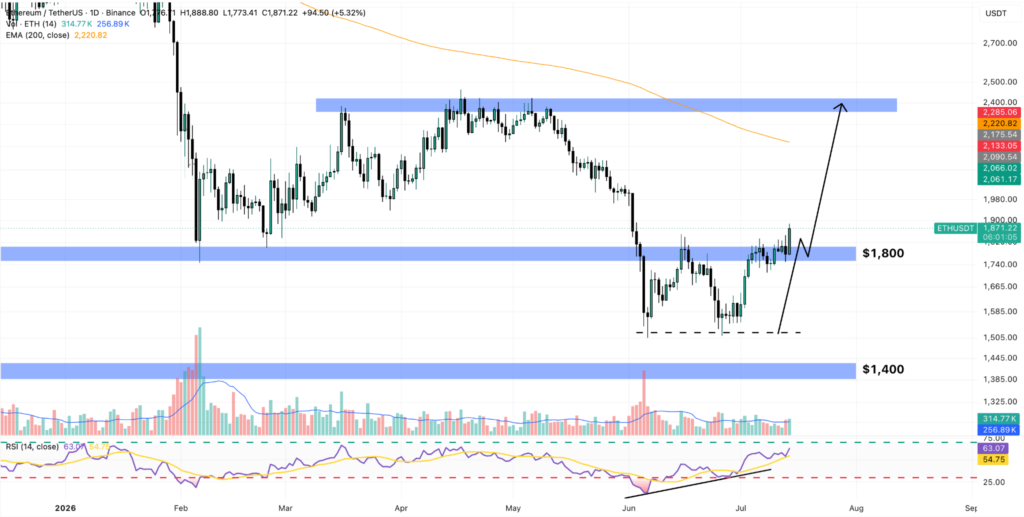
However, failure to clear the $2,200 resistance zone could result in a short-term consolidation period, with traders watching the former resistance level near $1,800 as potential support.
Ethereum Price Prediction: Path Toward $2,400 Remains Open
Ethereum’s current market structure has improved significantly due to a combination of strong technical indicators, higher trading volume, and a more supportive macroeconomic environment.
The breakout above $1,800, the confirmed double bottom formation, and the decline in bearish momentum suggest that ETH has established a foundation for further gains. The next critical levels are $2,200, represented by the 200-day EMA, followed by the longer-term target of $2,400.
Ethereum has also generated a weekly chart buy signal after the RSI dropped below 30, reaching deeply oversold conditions. This indicator historically suggests that long-term buyers may begin accumulating after significant market declines.
If bullish momentum continues and Ethereum successfully clears the 200-day EMA, the cryptocurrency could advance toward $2,400, representing a major recovery milestone. While volatility remains high across digital asset markets, current price action suggests that ETH is entering a technically stronger position after months of downside pressure.


