
Solana (SOL) is approaching a critical technical phase as traders evaluate whether the cryptocurrency can resume its recovery trend or experience another downside move. Despite recent weakness, SOL remains the strongest-performing asset among the top five cryptocurrencies over the past 30 days, gaining approximately 11%.
Read on as Drexeldev takes an in-depth look at this topic and explains the important details below.
However, short-term momentum has weakened. After failing to break through the $82 resistance zone, Solana declined by nearly 7% over the past seven days, falling back below the $80 psychological level. The rejection created a temporary sell wall, preventing buyers from pushing the asset toward higher resistance levels.
Institutional demand has also slowed. Crypto ETF inflows weakened sharply last week, with total inflows reaching only $1 million after a significant $9 million outflow on July 8. The decline in ETF demand suggests that large investors are currently taking a more cautious approach while waiting for stronger market confirmation.
The next major catalyst for SOL price volatility is the latest United States inflation report. Current forecasts expect annual inflation to decline to 3.8% in June, while monthly inflation is projected at -0.1%.
A weaker inflation reading could improve sentiment toward risk assets, increasing expectations of a more supportive monetary environment. However, a higher-than-expected inflation figure could trigger renewed selling pressure, as markets would likely price in a longer period of restrictive interest rates.
Historically, altcoins such as Solana are among the first assets affected during risk-off conditions because investors typically reduce exposure to volatile assets when financial conditions tighten. This macroeconomic pressure has contributed to SOL remaining below the important $100 resistance level for several months.
Solana On-Chain Activity Shows Investors Are Preparing for a Major Move
While price performance has been limited, Solana’s network activity is showing a notable shift. One of the most important metrics currently attracting attention is daily active users (DAUs), which provide insight into blockchain participation and investor positioning.
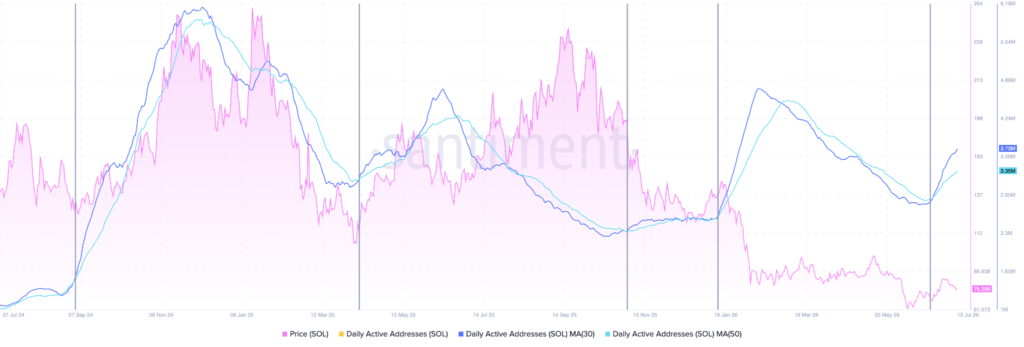
Recent data shows that Solana’s 30-day moving average of daily active users has crossed above its 50-day moving average. This technical crossover indicates a short-term acceleration in network activity and suggests that more wallets are interacting with the blockchain.
However, Solana’s application revenue remains under pressure. Weekly application fees recently dropped to approximately $5.8 million, representing an 88% decline from the yearly peak of $50 million recorded in February 2025.
Compared with the network’s historical weekly high of $491 million in January 2025, application fees are down approximately 98.5%, highlighting a significant slowdown in decentralized application activity.
Despite weaker fee generation, the increase in daily active wallets could become a leading indicator for future volatility. Previous instances of the DAU moving average crossover have resulted in major SOL price movements.
During the previous crossover event, Solana declined from approximately $140 to $92, creating a 34% correction. However, the earlier crossover produced a strong bullish move, with SOL rising from $112 to $184, representing a gain of approximately 64%.
This historical pattern shows that rising network activity does not automatically determine direction. Instead, it indicates that market participants are positioning for a major trend, which could result in either a bullish breakout or increased selling pressure.
SOL Technical Analysis: $73 Support Determines the Next Direction
From a technical perspective, Solana is currently trading inside an ascending price channel, a structure that typically indicates a developing bullish trend when support remains intact.
The key technical level is the $73 trend line support. As long as SOL remains above this zone, buyers maintain control of the short-term structure, and the cryptocurrency could attempt another move toward the upper boundary of the channel.
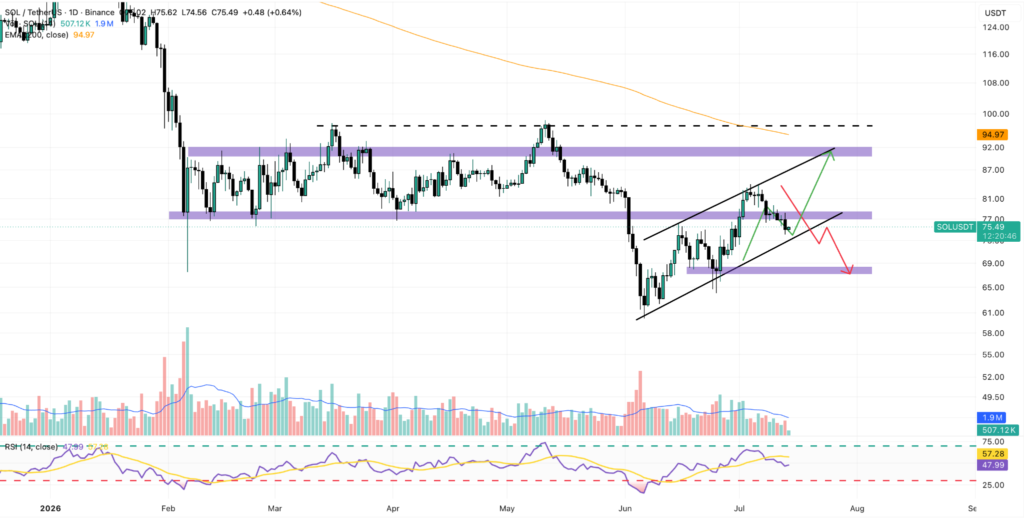
A successful defense of the $73 support area could push Solana toward the next major resistance level near $90. A breakout above $90 would improve market structure and potentially open the path toward higher targets.
However, a breakdown below $73 would invalidate the current bullish channel pattern. In that scenario, selling pressure could accelerate, with the next significant support level located around $68.
A decline toward $68 would represent an additional 11% downside risk from current levels and would signal that bearish momentum has strengthened.
Solana Forecast: High Volatility Ahead as Traders Watch Key Indicators
The next major move for Solana will likely depend on the combination of macroeconomic conditions, ETF flows, on-chain activity, and technical support levels.
The recent increase in daily active users suggests that investors are preparing for increased volatility, while the current ascending channel pattern keeps the bullish scenario active.
A sustained hold above $73 could allow SOL to retest $90, while a loss of support could send the price toward $68.
With inflation data acting as a major market catalyst and on-chain metrics showing renewed activity, Solana is positioned for a potentially significant move in the coming sessions.


