
Ethereum is currently navigating a decisive technical phase as price action compresses around the $1,500 demand zone, a level that has repeatedly attracted strong buying interest. This article offers an in-depth analysis of the topic from the brokers at Aicanx.
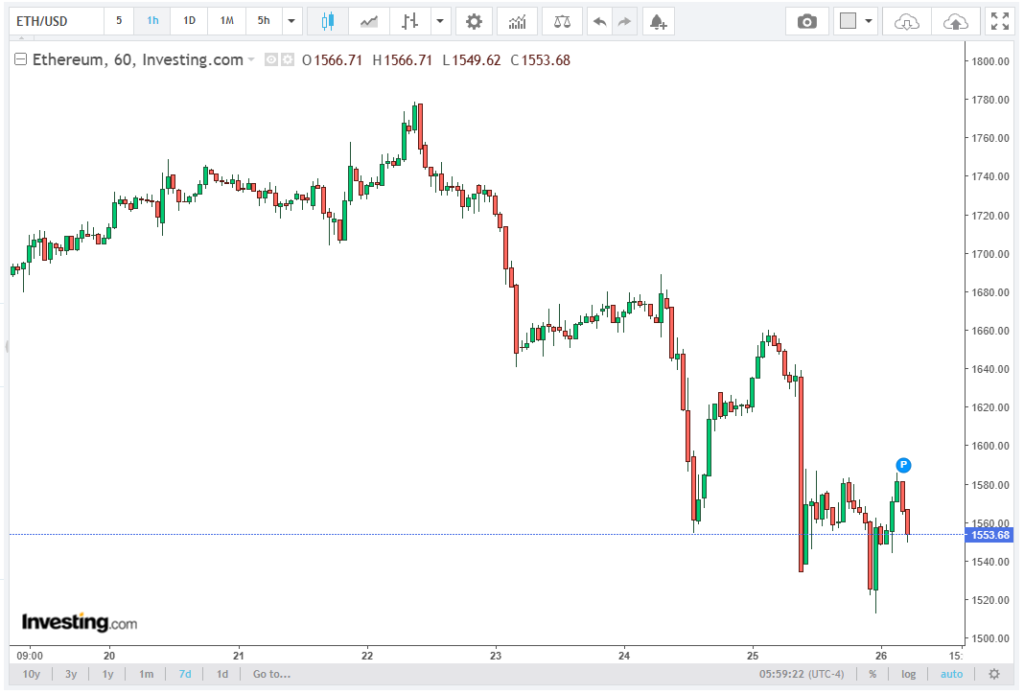
The latest selloff has pushed ETH down about 18.25% from its local high near $1,800, extending the broader corrective trend while keeping the price below key moving averages. Despite ongoing downside pressure, the market structure is notable for repeated long lower wicks around the $1,500 area.
These wicks suggest strong buyer absorption, where selling pressure is repeatedly met with demand that prevents sustained breakdowns. This behavior indicates the $1,500–$1,520 range is acting more like an accumulation zone than a fragile support level.
Support Zone Dynamics and Buyer Absorption
The current market structure shows Ethereum revisiting the $1,500 support zone, where bears previously failed to trigger a sustained breakdown earlier in June. This retest is technically important, as repeated defenses can reinforce a level’s market significance.
Friday’s action again produced a long lower wick in this area, suggesting sellers were initially in control but were met with strong buying pressure that pushed the price back up. If this pattern continues, the $1,500 zone could develop into a more durable structural floor and support a broader recovery attempt.
Technical Indicators: Oversold Signals Emerging
From a momentum perspective, Ethereum’s short-term trend remains weak, with price still trading below the 20-, 50-, 100-, and 200-day EMAs, confirming a broader bearish regime. However, early signs of reversal are emerging. The daily RSI is near 31, close to oversold conditions that have historically preceded relief rallies when supported by strong structure.
This combination of oversold momentum and repeated support tests increases the likelihood of a corrective bounce, especially if the week closes with a strong rejection wick from current levels.
Double Bottom Formation: A Developing Bullish Structure
`One of the most important technical developments is the potential formation of a double bottom pattern. The first trough formed in early June near $1,500, followed by a rebound toward $1,800, and the second retest is now unfolding at the same support zone.
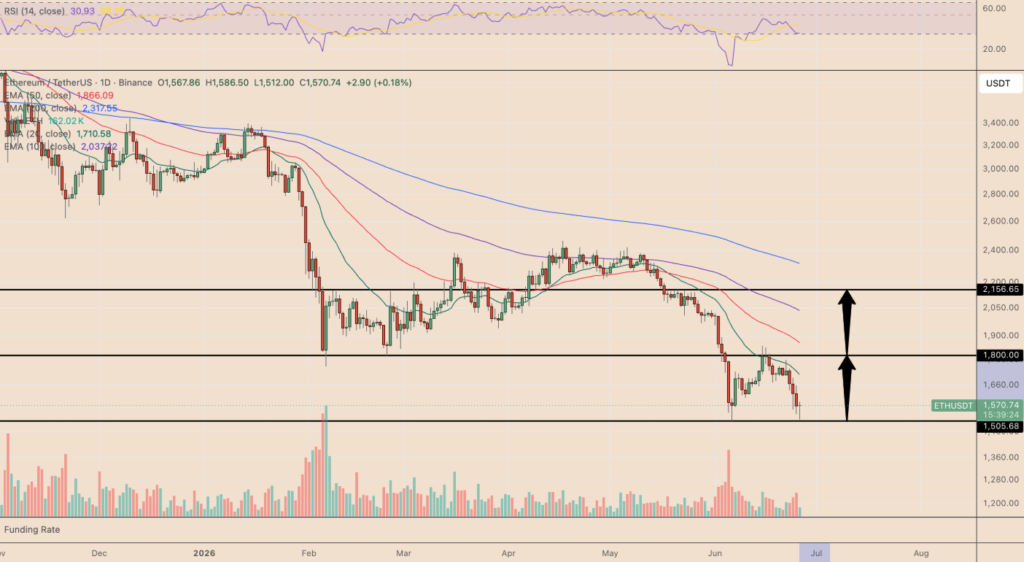
In classical technical analysis, a double bottom is considered a trend reversal pattern, especially when it forms after a prolonged decline. The key validation level for this structure is the neckline at approximately $1,800.
If Ethereum maintains the $1,500 floor and successfully rebounds, this structure becomes increasingly relevant. A confirmed breakout above the neckline would signal a shift in momentum from distribution to accumulation dominance.
Price Targets: $1,800 Breakout Toward $2,100–$2,150
A decisive rebound from the $1,500–$1,520 zone could drive a multi-week rally toward the $1,800 resistance area, now acting as a key technical barrier. This level previously served as support, so it may attract selling from trapped longs. Reclaiming the 20-day EMA would further strengthen a short-term reversal signal.
A daily close above $1,800 would confirm a double bottom breakout, with a measured move projection pointing toward $2,100–$2,150, implying a potential 15%–20% upside from current levels.
Bearish Invalidations and Risk Structure
Despite emerging bullish signals, the setup remains conditional. A failure to hold the $1,500 support zone would invalidate the double bottom structure and reintroduce downside continuation risk.
In that scenario, Ethereum could face accelerated selling pressure as stop-loss clusters beneath $1,500 are triggered, potentially leading to a deeper retracement phase.
Additionally, continued rejection below all major exponential moving averages (EMAs) would reinforce bearish trend dominance and delay any meaningful recovery attempts.
On-Chain Accumulation Signals and Institutional Behavior
On-chain flows add important context beyond charts. SharpLink Gaming appears to have resumed Ethereum accumulation after a long pause, with Arkham Intelligence reporting a wallet linked to the firm receiving 5,000 ETH (about $7.85 million) from FalconX.
This suggests some institutions are using the recent dip to rebuild exposure near perceived cycle lows. However, with an average cost basis near $3,609, the position remains underwater, indicating long-term strategic positioning rather than immediate bullish conviction. Such flows may still help stabilize sentiment in oversold conditions.
Conclusion: A High-Probability Reversal Zone, Not Yet Confirmation
Ethereum is at a technically sensitive juncture where support integrity, momentum exhaustion, and structural patterns are converging. The $1,500 zone remains the critical battleground between continuation of the downtrend and formation of a double bottom reversal setup.
A successful defense followed by a break above $1,800 would likely confirm a shift toward a recovery phase targeting $2,100–$2,150. However, failure to maintain current support would invalidate the bullish structure and reassert bearish dominance.
For now, Ethereum sits in a high-volatility equilibrium zone, where the next decisive move will likely define its medium-term trend trajectory.