
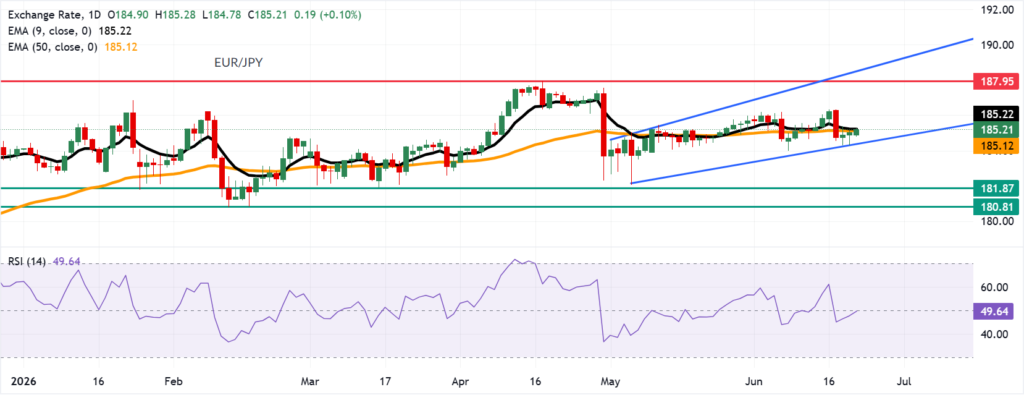
The EUR/JPY cross is trading around 185.20, extending gains for a third consecutive session while maintaining a controlled bullish structure above the 185.00 psychological level. Price action remains technically compressed between key moving averages, with the 9-day EMA at 185.22 acting as immediate resistance and the 50-day EMA at 185.12 functioning as the nearest dynamic support.
In this article, ClearSky Capital’s brokers take an in-depth look at this topic.
This narrow 0.10-point EMA band (185.12–185.22) highlights an active volatility squeeze condition, where directional momentum is temporarily constrained despite underlying trend persistence. The market continues to trade within an ascending channel structure, preserving a medium-term bullish bias while short-term momentum remains neutral.
Trend Structure and Moving Average Positioning
The EUR/JPY pair is currently positioned marginally above the 50-day EMA (185.12) by approximately +0.08%, reinforcing the presence of a positive medium-term trend bias. However, repeated rejection near the 9-day EMA (185.22) indicates that short-term momentum remains capped.
The separation between short-term and medium-term exponential averages is extremely tight at only 10 pips, reflecting low directional divergence and a market in equilibrium. Historically, such compression often precedes expansion phases once either boundary is breached with volume confirmation.
The broader ascending channel remains intact, with lower boundary support currently estimated near 184.50, while upper structural resistance extends toward 188.60. Price remains in the upper half of this channel, maintaining a bullish structural alignment despite intraday hesitation.
Momentum Conditions and RSI Analysis
The 14-day Relative Strength Index (RSI) is currently positioned at 49.6, effectively neutral and centered near the equilibrium level of 50.0. This reading confirms that the market is neither overbought nor oversold, but instead operating in a mean-reversion sensitive zone.
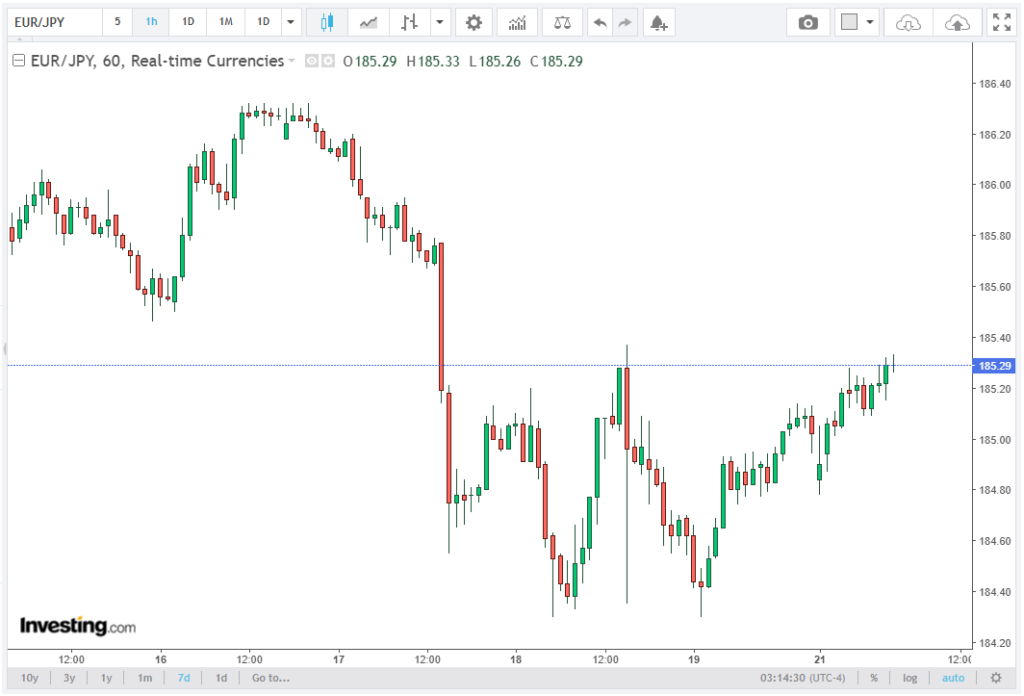
An RSI range between 45 and 55 typically reflects sideways consolidation with low directional conviction, which is consistent with current price behavior around the 185.00–185.25 range. The absence of RSI divergence further supports the interpretation that the market is awaiting a catalyst for directional expansion.
Volatility compression combined with neutral RSI often precedes a breakout volatility regime, particularly when the price is coiling near key moving averages, as observed here.
Immediate Resistance and Upside Projection
The first critical technical barrier is the 9-day EMA at 185.22, which is currently acting as a short-term supply zone. Multiple intraday rejections around this level confirm active selling pressure clustered near this threshold.
A sustained breakout above 185.22 would signal a structural shift in intraday momentum, opening the way for a retest of the recent high region near 186.20–186.80, which acts as an intermediate resistance cluster.
Beyond this zone, the next major structural resistance is located at 187.95, representing the year-to-date extreme high. A break above this level would confirm continuation of the broader bullish cycle and expose the upper channel boundary at approximately 188.60, which aligns with projected trend extension resistance.
From a Fibonacci extension perspective, a sustained breakout above 187.95 could project further upside expansion toward the 161.8% extension zone near 189.20, assuming momentum acceleration and volatility expansion.
Support Structure and Downside Risk Levels
Immediate support is located at the 50-day EMA (185.12), which remains the key intraday pivot. A breakdown below this level would indicate weakening short-term structure and increase the probability of a deeper retracement phase.
Below the 50-day EMA, the next structural support is located at 184.50, aligning with the lower boundary of the ascending channel. This level represents a critical trend defense zone, as a sustained break below it would invalidate the current channel-based bullish structure.
If bearish momentum accelerates beyond the channel floor, the next downside target emerges at 181.87, representing a prior swing low and significant liquidity zone. A further breakdown would expose 180.81, which serves as a medium-term structural support level and multi-month demand base.
The downside risk structure, therefore, spans approximately 4.5%–2.5% retracement potential depending on whether the channel support holds or fails.
Conclusion
The EUR/JPY cross is currently in a tightly compressed technical formation, trading at 185.20 between the 9-day EMA at 185.22 and the 50-day EMA at 185.12. The RSI at 49.6 confirms neutral momentum conditions, while the intact ascending channel structure preserves the broader bullish trend context.
Price action remains in a critical inflection zone where a breakout above 185.22 could trigger expansion toward 187.95 and 188.60, while a breakdown below 185.12 risks deeper retracement toward 184.50 and 181.87. The current structure is therefore best characterized as a high-compression equilibrium phase preceding directional volatility expansion.


