
The US Dollar Index (DXY) continues to trade in a clearly defined short-term bullish structure, holding near 100.93, up approximately 0.17% intraday. Price action remains firmly above the 20-day Exponential Moving Average (EMA) at 99.89, confirming that the prevailing trend bias remains upward in the near term. This article features ClearSky Capital’s brokers exploring the topic in depth.
From a quantitative perspective, the index has now sustained a multi-session advance above its short-term mean, with a price-to-EMA spread of roughly +1.04%, indicating persistent buy-side dominance. This positioning reflects strengthening demand for the USD basket against its six major counterparts, driven by a rapid repricing of interest rate expectations.
Interest Rate Pricing: Sharp Reacceleration in Hawkish Expectations
The main driver is a sharp repricing of Federal Reserve policy expectations. Markets now assign a 58.5% probability of at least two rate hikes this year, up from 17.1% a week ago, reflecting a rapid +41.4 percentage point shift toward a more hawkish outlook.
This aligns with updated projections showing 9 of 19 Fed policymakers now expecting additional tightening, compared with none previously, indicating a clear shift in policy consensus.
As a result, expectations for higher US front-end real rates have increased, widening yield differentials and strengthening the US dollar. The USD is responding to a rising real yield advantage, reinforcing underlying structural support for the currency.
Macro Data Pipeline: High-Impact Volatility Catalysts Ahead
Short-term price elasticity is expected to increase due to incoming high-frequency macro data, particularly the S&P Global Flash PMI (June) and the PCE Price Index (May).
The PMI release serves as a leading indicator of composite output momentum across manufacturing and services. Any reading above the neutral 50.0 threshold, particularly in the 52.0–54.0 expansion range, would reinforce growth resilience assumptions, indirectly supporting further hawkish policy repricing.
More structurally significant is the PCE inflation metric, which represents the Federal Reserve’s preferred gauge of underlying price pressures. Current market sensitivity is high due to recent inflation persistence in core components.
A monthly core PCE print above +0.3% m/m or an annualized acceleration above 2.8%–3.0% YoY would likely reinforce expectations of additional tightening cycles.
In volatility terms, implied moves in DXY around these events typically range between 0.4% and 0.9% intraday, depending on surprise magnitude versus consensus positioning.
Technical Configuration: Bullish Trend Integrity Maintained
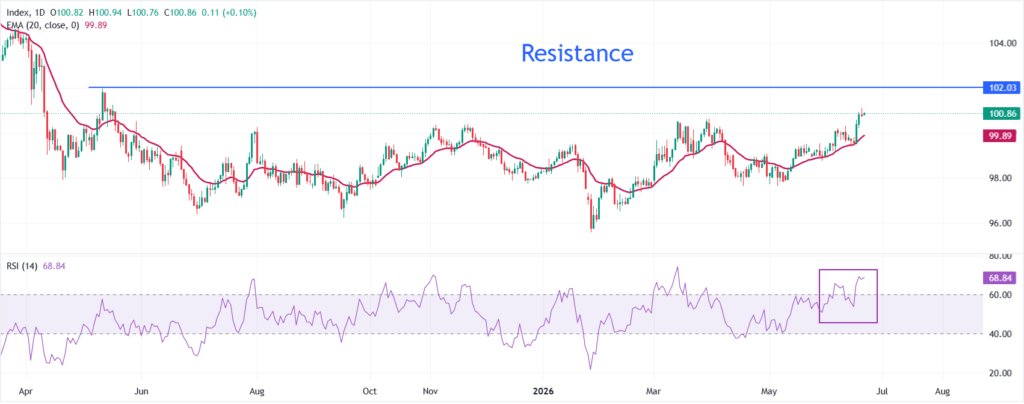
The index continues to hold above the 20-day EMA at 99.89, which now functions as a dynamic support zone. The sustained hold above this level confirms a positive trend gradient, with trend slope measurements indicating a rising trajectory of approximately +0.6 to +0.8 points per session over the short term.
Momentum indicators reinforce this structure. The Relative Strength Index (RSI) currently prints at 68.93, positioning the index just below the classical overbought threshold of 70. Historically, RSI readings in the 65–75 band during strong trend phases indicate continuation momentum rather than reversal, particularly when aligned with macro fundamental support.
Volatility compression analysis shows expanding directional bias, with higher lows forming consistently above 99.38, the June 15 swing low. This level represents a key structural support and coincides with the lower boundary of the current short-term trend channel.
On the upside, price is approaching a key technical inflection at 101.13, the June 19 swing high. A confirmed breakout above this level would represent a range expansion signal, triggering algorithmic momentum participation and likely accelerating price discovery toward the 102.00 zone.
Key Levels and Price Projection: Path Toward 102.00
The 102.00 level represents both a psychological and structural resistance zone aligned with prior multi-month highs. From a Fibonacci extension perspective, the current swing structure suggests a potential extension target near the 1.272–1.414 projection band, which aligns closely with the 101.80–102.20 region.
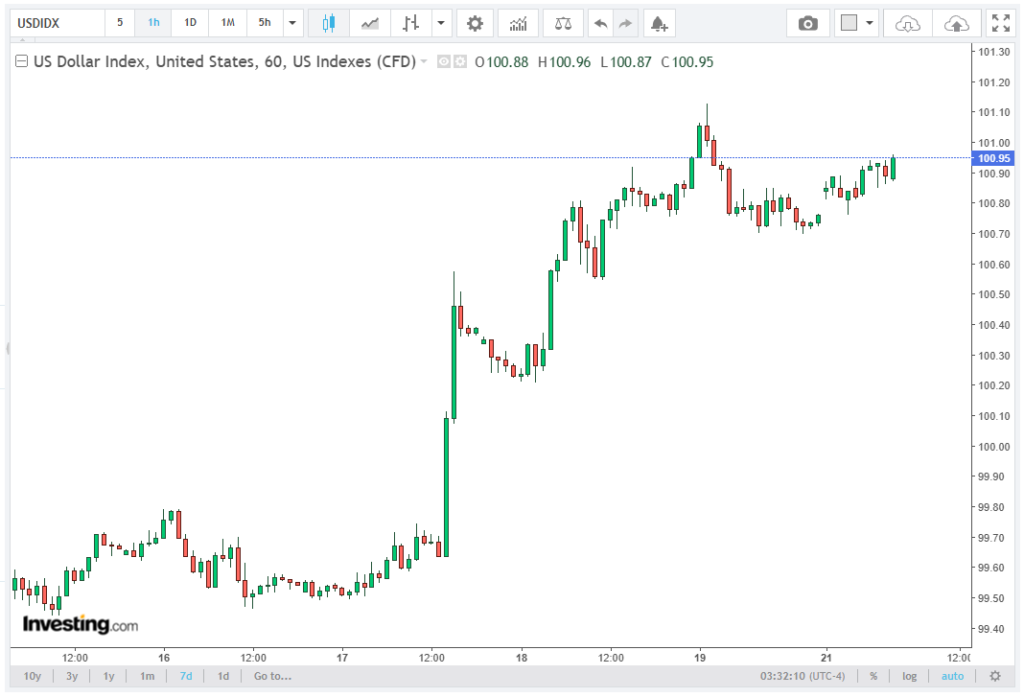
For continuation of the bullish scenario, the price must maintain structural integrity above 99.89 (20-day EMA). A breakdown below this threshold would shift momentum dynamics toward mean reversion, with downside exposure opening toward 99.38, and potentially deeper retracement zones depending on macro shock intensity.
However, as long as the price remains above the EMA and the RSI holds above 60, the probability-weighted bias remains tilted toward trend continuation rather than reversal.
Outlook: Trend Favors Extension Toward 102.00
The convergence of aggressive Fed repricing, improving yield differentials, and technically supportive price structure continues to favor upside extension in the US Dollar Index. The market is increasingly embedded in a hawkish macro regime, where interest rate expectations are the dominant driver of FX valuation.
Under current conditions, the path of least resistance remains upward, with 101.13 as the immediate trigger level and 102.00 as the next major structural objective within the prevailing bullish cycle.


