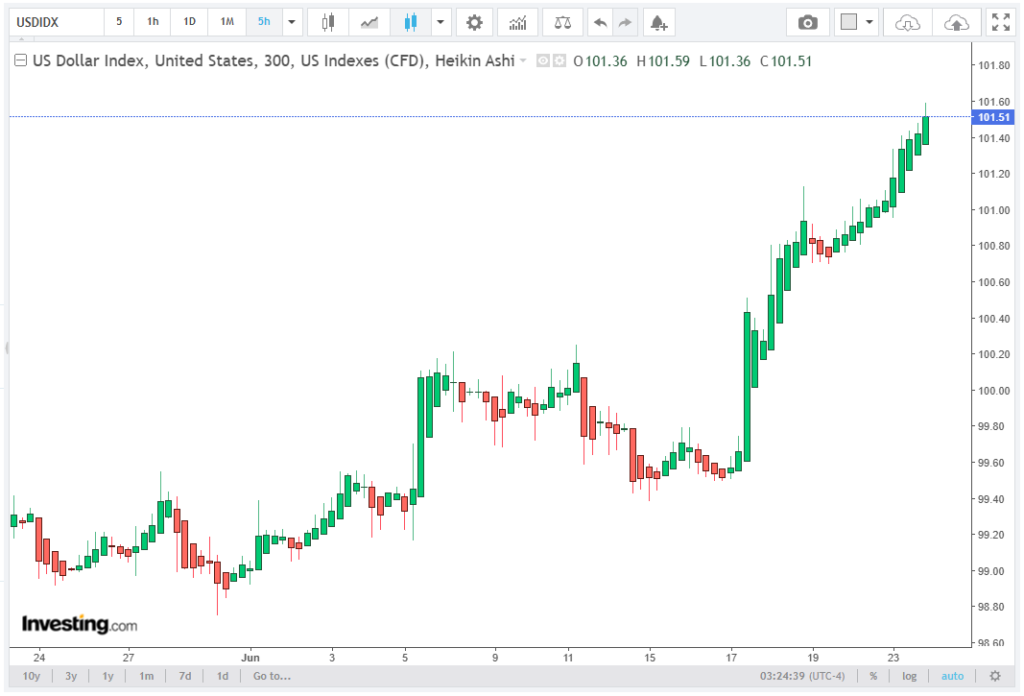
The US Dollar Index (DXY) stayed solid above 101.50 on Wednesday in Europe, building on its recent climb. Investors now see the Federal Reserve sticking with higher interest rates for longer, and that’s powering the dollar’s rally. Even though some technical signals show the dollar’s getting pretty close to overbought territory, the bigger picture still looks strong and bullish.
Aicanx’s economic research team took a closer look at what’s really driving the dollar’s strength and pointed out the key levels traders need to watch. The story is pretty simple: investors are betting that the Fed won’t be cutting rates anytime soon, and that’s keeping the demand for dollars high. If you’re a trader, you’ll want to keep an eye on how the Fed’s next moves and market expectations shape things from here.
According to the economic research team at Aicanx, the latest move higher in the DXY highlights the market’s renewed focus on inflation risks, resilient US economic data, and widening yield differentials between the United States and other major economies. Although several momentum indicators suggest the rally is approaching overbought territory, the broader technical structure remains firmly constructive.
Unless a significant shift in Federal Reserve expectations occurs, buyers are likely to remain in control.
Rate Expectations Continue to Fuel Dollar Strength
The primary catalyst behind the dollar’s advance remains the sharp repricing of US interest rate expectations.
Market participants have significantly increased the odds of additional Federal Reserve tightening in recent days. Expectations for a 25-basis-point rate hike in July have climbed to 36.3% from just 8.5% a week earlier, while the probability of a September increase has surged to approximately 70.3%, up from 29.1%.
As expectations for higher US interest rates strengthen, Treasury yields have continued to outperform many of their global counterparts. The widening yield differential has reinforced demand for the US dollar, particularly against lower-yielding major currencies.
The DXY has now appreciated roughly 1.5% to 2.0% from its recent lows near the 100.00 psychological level, reflecting strong institutional buying with only shallow pullbacks interrupting the move.
Technical Trend Remains Firmly Bullish
From a technical standpoint, the index continues to trade comfortably above several important moving averages.
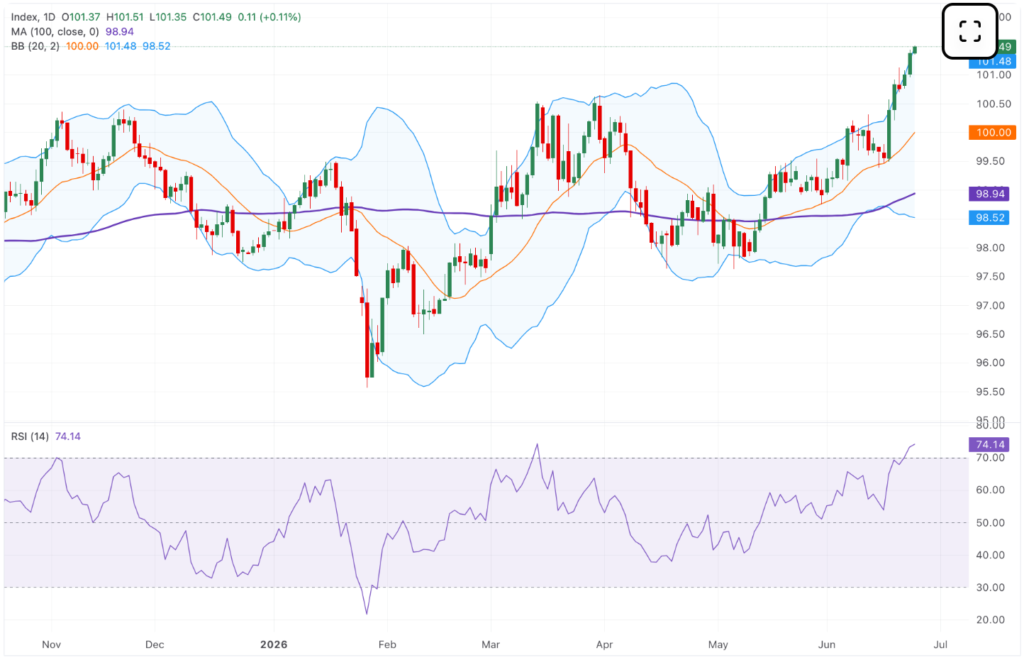
Price remains above both the 20-day Simple Moving Average and the 100-day SMA near 98.95, confirming that buyers continue to control the medium-term trend. The current distance between price and the 100-day average exceeds 2.5%, a signal that momentum remains considerably stronger than normal market conditions.
The index is also trading above the midpoint of the Bollinger Bands, reinforcing the current bullish structure and suggesting volatility continues to expand in favor of buyers.
As long as the DXY remains above the 100.00 support zone, the broader technical outlook continues to favor additional upside.
Momentum Signals Increasing Exhaustion Risk
Despite the strong uptrend, technical indicators suggest the rally is becoming increasingly stretched. The Relative Strength Index (RSI) has climbed to around 74, placing the DXY firmly in overbought territory. While RSI readings above 70 often accompany strong bullish trends, they also increase the likelihood of short-term consolidation or modest pullbacks rather than signaling an immediate reversal.
At the same time, the DXY is trading near the upper Bollinger Band, another sign that the recent advance may be overextended in the short term. Although the broader bullish trend remains intact, traders should be prepared for a period of consolidation before the next significant move higher.
Key Levels to Watch
Immediate support lies between 101.48 and 101.55, where the upper Bollinger Band is now acting as dynamic support. If the index pulls back further, 100.00 remains the key structural support, followed by the 100-day SMA at 98.95. A break below these levels would signal a deeper corrective phase.
On the upside, resistance is positioned at 101.95–102.00. A decisive breakout above this zone would confirm renewed buying momentum and could pave the way for further gains. Until then, traders should watch these levels closely as they are likely to determine the DXY’s next directional move.
Outlook
The US Dollar Index remains supported by rising Federal Reserve rate expectations, widening yield differentials, and strong technical momentum. These factors continue to favor buyers despite signs that the rally has become increasingly stretched.
Overbought momentum and a brush with the upper Bollinger Band make a short-term pause pretty likely, but the bigger trend is still positive. As long as the DXY doesn’t slip below important support, pullbacks look more like normal breathers than a real change in direction. For now, the easiest move is still upward, though traders should watch out for some sideways action while the market takes a break and gets ready for another possible push higher.