
The US Dollar Index (DXY) is extending its decline for the second consecutive trading session, currently trading near 100.80 during the early European session on Wednesday. The index remains positioned close to the lower boundary of the ascending channel, keeping the broader technical structure mildly bullish despite recent downside pressure.
In the article below, Drexeldev provides a closer look at this topic and what it means for readers.
The DXY, which measures the performance of the US Dollar against six major currencies, continues to trade inside an established ascending channel formation on the daily timeframe.
This technical pattern indicates that the medium-term trend remains supported by higher lows and a gradual recovery structure. However, the index is currently facing resistance below the 101.00 psychological level, limiting immediate upside momentum.
Momentum Indicators Show Neutral Market Conditions
The technical indicators on the daily chart suggest that market momentum is currently balanced between buyers and sellers. The 14-day Relative Strength Index (RSI) is positioned near 52, indicating neutral momentum conditions.
An RSI reading above 50 generally reflects a slight bullish advantage, while a level below 70 indicates that the market is not yet in an overbought condition. The current RSI level suggests that the recent Dollar recovery has lost some momentum but has not yet triggered a significant bearish reversal.
The nine-day EMA at 100.98 remains the first immediate resistance level. The DXY is trading below this short-term moving average, indicating that short-term buying pressure is currently insufficient to generate a stronger upside breakout.
At the same time, the index remains above the 50-day EMA near 100.23, which continues to act as a key medium-term support indicator. Holding above this moving average keeps the broader bullish technical bias intact and prevents a deeper correction from developing.
Bullish Scenario: Break Above 100.98 Could Target 101.80 and 102.90
A recovery above the nine-day EMA at 100.98 would represent an important technical improvement for the US Dollar Index. A sustained move above this level would confirm renewed short-term buying interest and could shift momentum back in favor of the bulls.
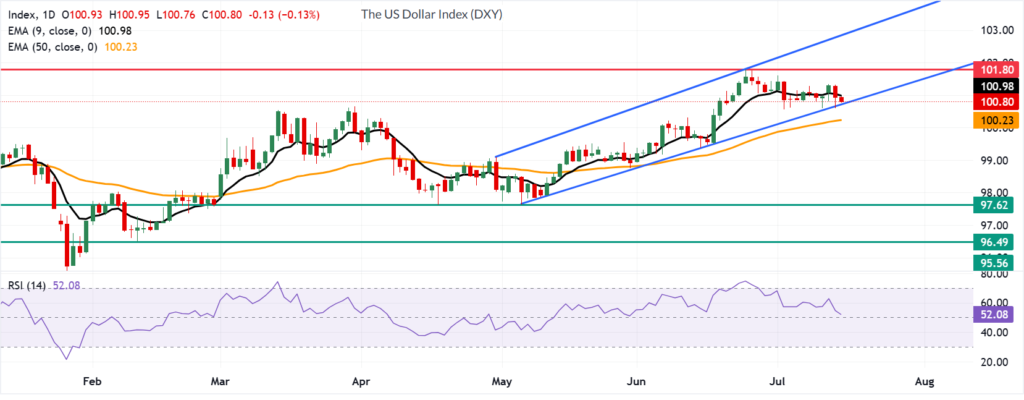
The next major resistance level would be the 14-month high at 101.80, recorded on June 24. A move toward this level would indicate that the index is attempting to resume its broader upward trajectory after the recent consolidation phase.
Above 101.80, the next technical objective would be the upper boundary of the ascending channel near 102.90. This area represents a significant resistance zone because it aligns with the projected top of the current bullish channel structure.
A break above 102.90 would strengthen the longer-term bullish outlook and suggest that the Dollar Index could enter a new expansion phase. However, failure to reclaim 100.98 would likely keep price action limited within the current consolidation range.
Bearish Scenario: Break Below 100.80 Would Weaken the Structure
The primary support level for the US Dollar Index remains at the ascending channel lower boundary near 100.80. This level is currently acting as a critical technical barrier separating continued bullish structure from a potential downside breakdown.
A successful defense of 100.80 would indicate that buyers remain active at lower prices and could provide the foundation for another attempt toward 101.00 and above. However, a decisive daily close below this level would weaken the ascending channel pattern and increase selling pressure.
The next important support area is located near the 50-day EMA at 100.23. This moving average represents a key trend filter, and a break below it would signal that short-term bearish momentum is strengthening.
If the DXY falls below the 100.80–100.23 support zone, sellers could target the region around the five-month low of 97.62, recorded on May 6. A move toward this area would represent a significant technical correction and would invalidate the current short-term bullish structure.
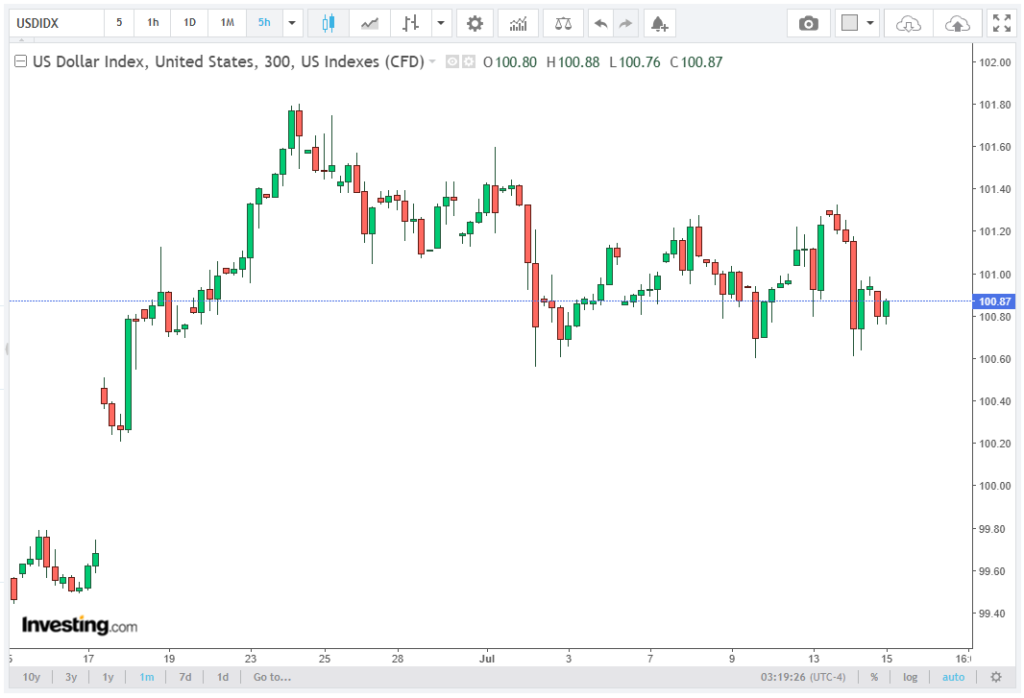
US Dollar Index Forecast: Key Levels Remain in Focus
The current DXY technical outlook remains neutral to mildly bullish as the index trades near the bottom of its ascending channel while holding above the 50-day EMA. The combination of RSI near 52, support from the medium-term moving average, and resistance from the nine-day EMA at 100.98 suggests that the market is waiting for a decisive breakout.
A move above 100.98 would increase the probability of a retest of 101.80, followed by 102.90. Conversely, a breakdown below 100.80 would expose the index to further losses toward 100.23 and potentially 97.62.
Until a breakout occurs, the US Dollar Index is likely to remain in a technical consolidation phase, with traders closely monitoring the ascending channel support, moving average levels, and momentum indicators for the next directional signal.


