
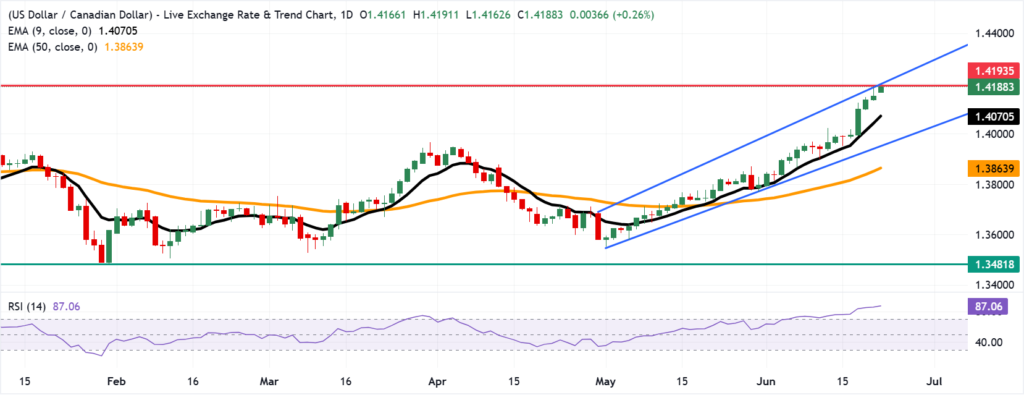
The USD/CAD pair extended its bullish sequence for the 8th consecutive session, printing a fresh 14-month high at 1.4193 before stabilizing near 1.4180 in early European trading. The brokers at ClearSky Capital discuss this topic thoroughly in the article.
From a measured move perspective, the pair has advanced approximately +2.6% from the 1.3850 base zone, maintaining a near-linear bullish slope of roughly 0.18–0.22% per session over the latest impulse leg. This pace confirms a momentum-driven expansion phase rather than a corrective retracement cycle.
The current positioning near 1.4190–1.4200 aligns precisely with the upper boundary of the channel, establishing a clear technical inflection zone where trend continuation must either confirm via breakout or transition into consolidation.
Moving Averages and Trend Validation
The bullish bias remains structurally supported by moving average alignment. Price is trading above both the 9 EMA at 1.4070 and the 50-day EMA at 1.3863, preserving a clear positive trend structure.
The distance from the 9 EMA (about +110 pips) and the 50-day EMA (around +320 pips) reflects strong trend momentum, but also a growing deviation from mean levels. Historically, moves exceeding roughly +0.8% to +1.0% above the short-term EMA often lead to short pauses or volatility compression.
The EMA slope remains positive, with the 9 EMA rising at an estimated +0.12–0.15% per session, supporting continued trend progression. The 50-day EMA continues to act as a broader trend floor, keeping the bullish regime intact as long as price holds above the 1.3860–1.3880 zone.
Momentum Conditions and RSI Exhaustion Metrics
The 14-day RSI is currently near 87, an extreme overbought level. Readings above 70 signal overbought conditions, while levels above 80 usually reflect strong impulsive trend phases.
At 87, the market is in a stretched momentum zone where continuation is still possible, but less sustainable without short-term consolidation or pullback. There is no confirmed bearish divergence, as price continues to make higher highs alongside rising momentum.
Sustained RSI in the 85–90 range points to strong directional flow and limited counter-trend pressure. However, historically, such levels often precede either a brief consolidation (2–3 sessions) or a mean reversion toward the 9-EMA.
Resistance Cluster: 1.4190–1.4200 Confluence Barrier
Key resistance is the 1.4190–1.4200 zone, where several factors converge: the ascending channel top, the 14-month high at 1.4193, and the psychological level at 1.4200.
This creates a strong multi-layer resistance area, where a valid breakout requires sustained acceptance above 1.4200, not just brief spikes. A daily close above this level would likely invalidate the current channel ceiling and open the way toward the 1.4300–1.4380 region, based on projected channel extension.
If price fails to break through, the broader uptrend structure remains intact, but it increases the chance of a pullback toward mid-channel support around 1.4050–1.4100.
Support Structure and Downside Thresholds
Immediate support is at the 9-day EMA around 1.4070, which acts as the first dynamic support and aligns with minor intraday consolidation, making it an important short-term liquidity zone.
A break below 1.4070 would weaken short-term momentum and expose support near 1.3960, the channel midpoint, which also serves as a prior breakout retest area and secondary demand zone.
Further downside would shift focus to the 50-day EMA at 1.3863, a key broader trend level. A daily close below this would signal a transition from bullish momentum into a more neutral consolidation phase, weakening the current impulse structure.
Volatility and Market Compression Dynamics
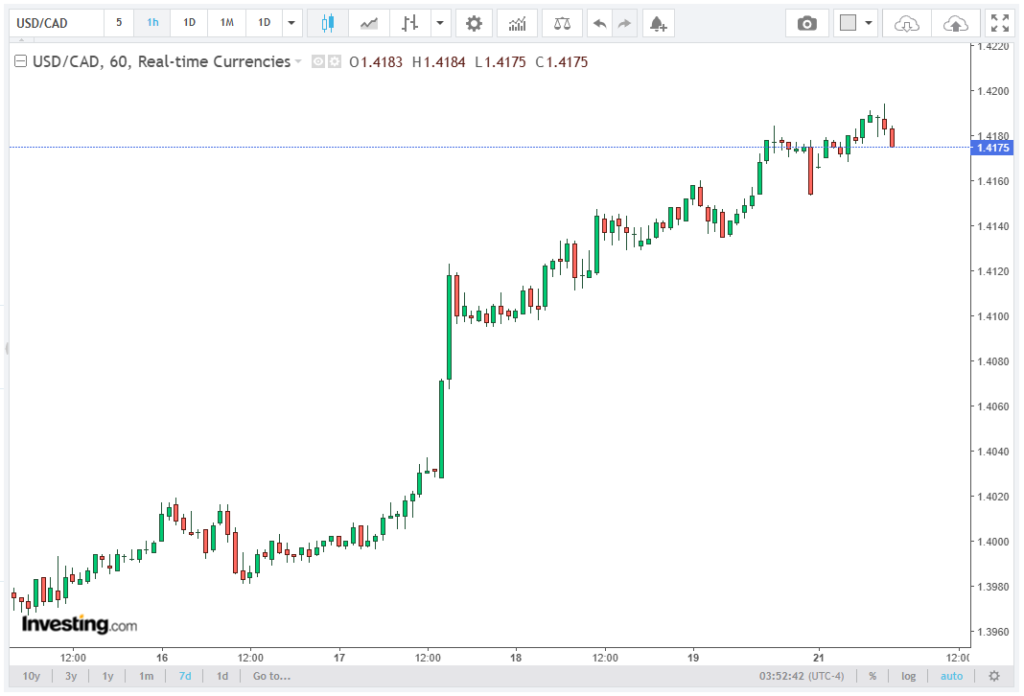
Current volatility expansion is evident through widened daily range behavior, with recent candles averaging approximately 90–120 pips per session, compared to the prior 20-day average of roughly 60–75 pips. This indicates an active volatility expansion phase aligned with directional breakout behavior.
However, as price approaches upper channel resistance, volatility compression risk increases due to potential order book imbalance near the 1.4200 liquidity cluster. Such zones typically produce either sharp breakout continuation or fast rejection retracement cycles.
Outlook: Momentum-Driven Trend Facing Structural Inflection
The prevailing technical structure remains bullish with high momentum intensity, supported by sustained positioning above key EMAs and continuous higher-high formation. However, the combination of RSI at 87, proximity to channel resistance, and extended deviation from the 9-EMA at 1.4070 indicates a developing technical stress zone.
The next directional resolution is highly dependent on the 1.4190–1.4200 reaction zone. A confirmed breakout above this level would extend the impulse structure and accelerate trend continuation, while rejection would likely trigger a controlled retracement toward 1.4070 and 1.3960, preserving the broader ascending channel architecture.
The market is therefore positioned at a critical technical equilibrium point, where momentum remains strong but increasingly stretched relative to underlying mean-reversion dynamics.


