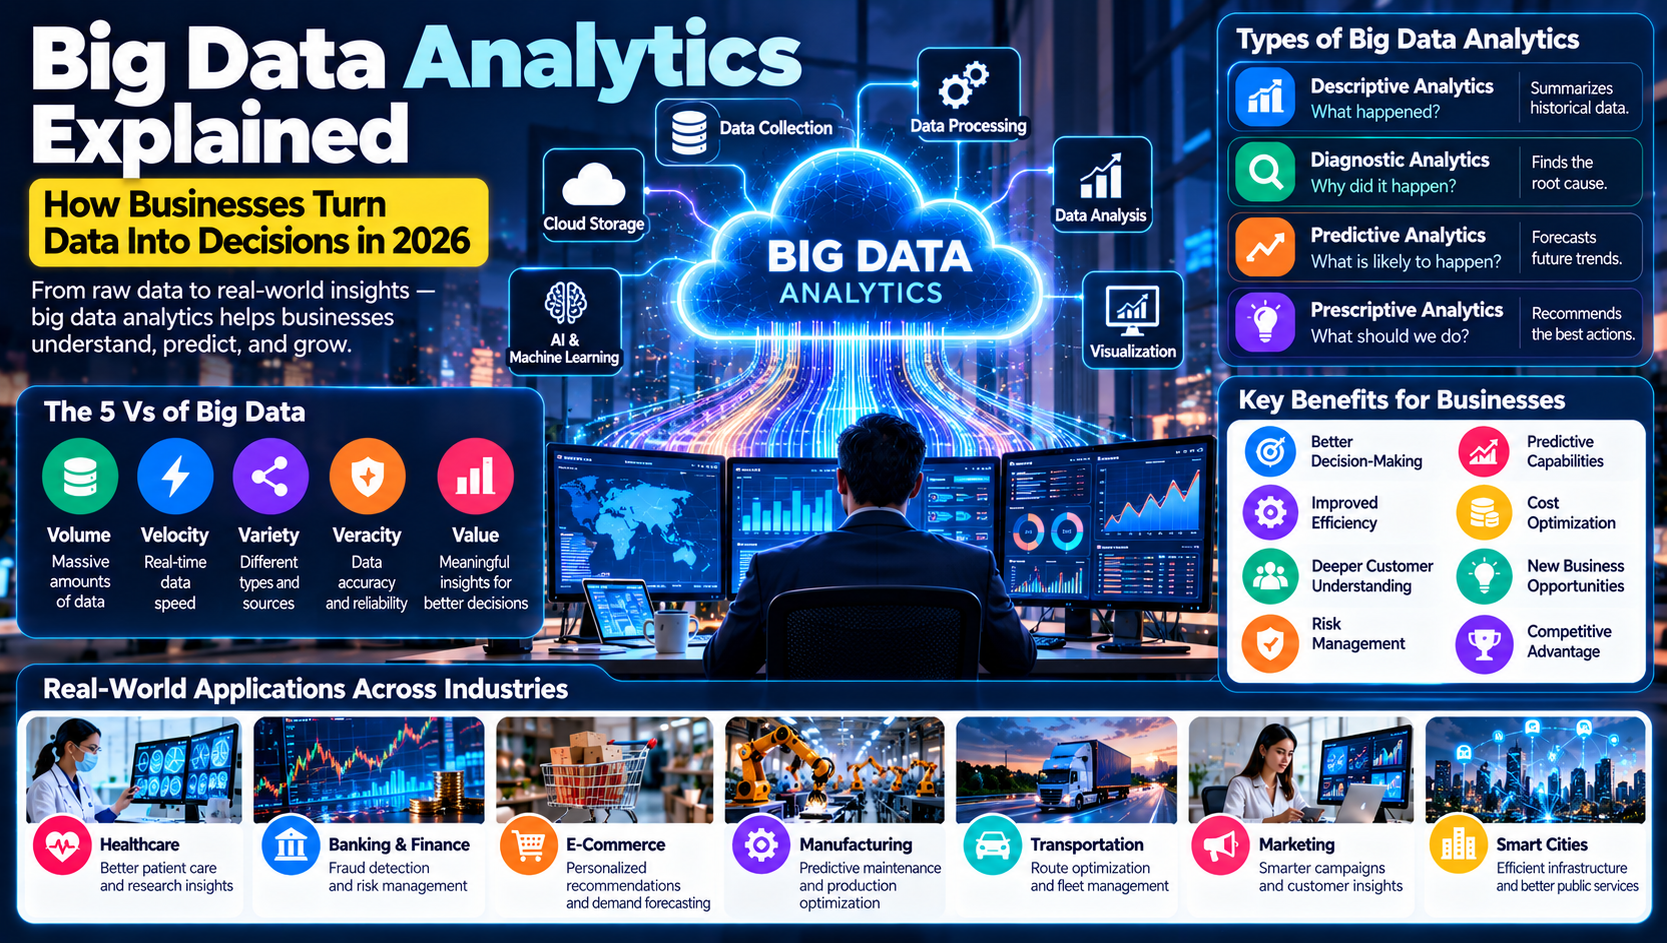
Every day, businesses generate enormous amounts of information through websites, mobile applications, online transactions, customer interactions, connected devices, and digital platforms. But collecting information is only the beginning. The real value comes from understanding it and using it to make better decisions.
This is where big data analytics becomes important.
Big data analytics helps organizations examine large and complex datasets to identify patterns, understand customer behavior, improve operations, predict future trends, and discover new business opportunities.
From e-commerce recommendations and banking fraud detection to healthcare research and supply chain management, data analytics is transforming how organizations operate.
In 2026, businesses are increasingly combining big data analytics with artificial intelligence, machine learning, cloud computing, and real-time processing to gain deeper insights and respond faster to changing conditions.
This guide explains what big data analytics is, how it works, its major types, benefits, challenges, popular tools, and practical applications across industries.
What Is Big Data Analytics?
Big data analytics is the process of examining extremely large, complex, and diverse datasets to discover useful information, identify patterns, and support better decision-making.
Traditional data analysis methods may struggle when information grows beyond what conventional systems can efficiently store, process, or analyze.
Big data analytics uses specialized technologies and techniques to handle information from multiple sources, including:
Websites and mobile applications
Social media platforms
Online shopping transactions
Customer databases
Business software systems
Internet of Things (IoT) devices
Financial transactions
Sensors and industrial equipment
Digital advertising campaigns
For example, an online retailer may analyze millions of customer interactions to understand which products are popular, when customers are most likely to purchase, and which recommendations improve sales.
Instead of relying entirely on assumptions, the company can use data to make more informed decisions.
In simple terms, big data analytics turns large amounts of raw information into meaningful business insights.
What Is Big Data?
Big data refers to datasets that are too large, fast-moving, or complex for traditional data management approaches to handle efficiently.
It can include structured, semi-structured, and unstructured information.
Types of Data
1. Structured Data
Structured data is organized in a predefined format, usually in rows and columns.
Examples include:
Customer databases
Sales records
Financial transactions
Inventory spreadsheets
Employee information
2. Unstructured Data
Unstructured data does not follow a fixed table-based format.
Examples include:
Images
Videos
Audio recordings
Emails
Social media posts
Documents and PDF files
3. Semi-Structured Data
Semi-structured data does not follow a traditional relational database structure but contains elements that help organize it.
Examples include:
JSON files
XML documents
Application logs
Web server records
Businesses often combine all three types to develop a more complete understanding of their operations and customers.
The Five Vs of Big Data
Big data is commonly explained through five important characteristics known as the Five Vs.
Characteristic | Meaning | Example |
|---|---|---|
Volume | The amount of data generated and stored | Millions of customer transactions |
Velocity | The speed at which data is created and processed | Live payment activity |
Variety | Different formats and sources of data | Text, video, images, and databases |
Veracity | The accuracy and reliability of data | Identifying incorrect customer records |
Value | The useful insights obtained from data | Improving business decisions |
1. Volume
Organizations generate enormous amounts of information through digital activities. Managing this growing volume requires suitable storage and processing infrastructure.
2. Velocity
Some information needs to be processed immediately. For example, financial institutions may analyze transactions in real time to identify suspicious activity.
3. Variety
Businesses collect information in different formats, making data integration and analysis more complex.
4. Veracity
Data quality matters. Incorrect, incomplete, duplicated, or outdated information can produce misleading results.
5. Value
The ultimate purpose of big data analytics is to create meaningful value. Data becomes useful when it helps organizations solve problems, reduce costs, improve services, or identify opportunities.
How Does Big Data Analytics Work?
Big data analytics involves several connected stages. Each stage helps transform raw information into insights that organizations can use.
1. Data Collection
The first step is collecting information from different sources.
These may include websites, applications, customer databases, connected devices, business systems, and digital transactions.
For example, an e-commerce company may collect product searches, shopping cart activity, customer purchases, and website traffic information.
2. Data Storage
After collection, information needs to be stored in suitable systems.
Organizations may use:
Cloud storage platforms
Data warehouses
Data lakes
Distributed databases
On-premises storage systems
The appropriate solution depends on data volume, accessibility, security, and processing requirements.
3. Data Cleaning and Preparation
Raw information often contains errors, duplicate records, missing values, and inconsistent formats.
Data preparation helps improve quality before analysis.
Common activities include removing duplicates, correcting formatting problems, validating records, and organizing information.
4. Data Processing
Data processing transforms collected information into a format that can be analyzed.
Depending on the application, processing may happen in batches or continuously as new information arrives.
5. Data Analysis
Analysts use statistical methods, machine learning models, and analytical tools to identify patterns and relationships.
For example, a retailer may examine purchasing behavior to identify which products are frequently purchased together.
6. Data Visualization
Results can be presented through charts, graphs, dashboards, and reports.
Visualizations make complex information easier to understand and communicate.
7. Decision-Making and Action
The final stage involves using insights to make practical decisions.
A business may adjust inventory, improve marketing campaigns, change pricing strategies, or optimize its operations based on analytical findings.
The big data analytics process:
Data Collection → Data Storage → Data Cleaning → Data Processing → Data Analysis → Visualization → Business Decisions
Types of Big Data Analytics
Big data analytics is commonly divided into four major categories. Each type answers a different business question.
1. Descriptive Analytics
Descriptive analytics explains what has already happened.
It summarizes historical information and helps organizations understand past performance.
Examples include:
Monthly sales reports
Website traffic analysis
Customer purchase summaries
Revenue dashboards
Marketing campaign reports
Business question: What happened?
2. Diagnostic Analytics
Diagnostic analytics investigates why something happened.
It examines data to identify possible causes, relationships, and contributing factors.
For example, a company experiencing declining sales may analyze customer feedback, product availability, pricing, and marketing performance to understand the reasons.
Business question: Why did it happen?
3. Predictive Analytics
Predictive analytics uses historical information, statistical techniques, and machine learning to estimate what may happen in the future.
Applications include:
Sales forecasting
Customer churn prediction
Equipment failure prediction
Demand forecasting
Fraud risk assessment
Predictions are estimates rather than guarantees. Their reliability depends on data quality, model design, and changing conditions.
Business question: What is likely to happen?
4. Prescriptive Analytics
Prescriptive analytics recommends possible actions based on available information, objectives, and constraints.
For example, a delivery company may analyze traffic, vehicle availability, and delivery schedules to recommend efficient routes.
Business question: What should we do?
Comparison of the Four Types
Type | Main Purpose | Example |
|---|---|---|
Descriptive | Understand past events | Monthly sales report |
Diagnostic | Identify causes | Investigating falling sales |
Predictive | Estimate future outcomes | Forecasting product demand |
Prescriptive | Recommend actions | Optimizing delivery routes |
Together, these analytical approaches help organizations move from understanding historical performance to making forward-looking decisions.
Real-World Applications of Big Data Analytics
Big data analytics is used across multiple industries to improve efficiency, understand customers, manage risks, and support innovation.
1. Healthcare
Healthcare organizations generate information through patient records, medical devices, diagnostic systems, laboratory results, and research.
Big data analytics can help healthcare professionals:
Identify patterns in patient information
Support medical research
Monitor hospital operations
Analyze public health trends
Improve resource planning
Support early identification of potential health risks
For example, hospitals can analyze admission patterns to plan staffing and allocate resources more effectively.
Analytical tools support clinical decisions but do not replace qualified medical professionals.
2. Banking and Finance
Financial institutions use data analytics to monitor transactions, assess risk, and understand customer behavior.
Applications include:
Fraud detection
Credit risk assessment
Transaction monitoring
Financial forecasting
Customer segmentation
Regulatory reporting
For example, a bank may analyze transaction patterns to identify activity that differs significantly from a customer's normal behavior.
3. E-Commerce and Retail
Online retailers collect information from product searches, customer purchases, website activity, reviews, and shopping carts.
Analytics can help businesses:
Recommend relevant products
Forecast customer demand
Manage inventory
Understand purchasing behavior
Improve marketing campaigns
Identify popular products
Personalized recommendations are one of the most visible examples of data analytics in everyday life.
4. Manufacturing
Manufacturers use data from production equipment, industrial sensors, supply chains, and quality control systems.
Big data analytics can support:
Predictive maintenance
Production optimization
Quality monitoring
Equipment performance analysis
Supply chain management
Energy consumption monitoring
For example, a factory may analyze machine temperature and vibration data to identify possible equipment problems before a breakdown occurs.
5. Transportation and Logistics
Transportation companies use analytics to understand traffic patterns, manage vehicles, and improve delivery operations.
Common applications include:
Route optimization
Fleet monitoring
Delivery forecasting
Fuel consumption analysis
Shipment tracking
Traffic prediction
These applications can help organizations improve operational visibility and manage transportation resources.
6. Marketing and Advertising
Marketing teams use data analytics to understand audiences and measure campaign performance.
They can analyze:
Website visits
Customer engagement
Conversion rates
Advertising performance
Customer acquisition costs
Purchase behavior
For example, a marketing team may compare campaign results to understand which audience segments respond most effectively to a particular advertisement.
7. Telecommunications
Telecommunications companies generate large amounts of network and customer information.
Analytics can help them monitor network performance, identify service problems, understand customer usage, and predict potential customer churn.
8. Education
Educational institutions can use analytics to examine student performance, attendance, course engagement, and learning patterns.
These insights may help institutions identify areas where students need additional support and improve resource planning.
9. Energy and Utilities
Energy companies use data from smart meters, power systems, and connected equipment.
Analytics can support energy demand forecasting, infrastructure monitoring, consumption analysis, and maintenance planning.
Benefits of Big Data Analytics
Big data analytics offers important advantages when organizations collect reliable information and use appropriate analytical methods.
1. Better Decision-Making
Data-driven insights help organizations make decisions based on evidence rather than assumptions alone.
2. Improved Operational Efficiency
Businesses can identify inefficient processes, unnecessary costs, and areas where resources are not being used effectively.
3. Deeper Customer Understanding
Analyzing customer behavior can help organizations understand preferences, purchasing patterns, and service expectations.
4. More Effective Marketing
Businesses can use analytical insights to improve audience targeting, campaign measurement, and marketing strategies.
5. Risk Management
Financial institutions and other organizations can use analytics to identify unusual patterns and assess potential risks.
6. Predictive Capabilities
Predictive models can help organizations estimate demand, identify possible equipment failures, and plan for future business conditions.
7. Competitive Advantage
Organizations that use data effectively may identify opportunities faster, respond to market changes, and improve customer experiences.
8. Innovation and New Opportunities
Analyzing large datasets can reveal unmet customer needs, emerging trends, and opportunities to develop new products or services.
Challenges of Big Data Analytics
Despite its benefits, implementing big data analytics can be challenging.
1. Data Privacy and Security
Organizations may collect sensitive customer, financial, or operational information.
Poor security practices can expose this data to unauthorized access, theft, or misuse.
Businesses should use encryption, access controls, secure storage, and appropriate data protection policies.
2. Poor Data Quality
Incorrect, incomplete, duplicated, or outdated information can produce unreliable analytical results.
Organizations need processes for validating and maintaining data quality.
3. High Implementation Costs
Big data projects may require investment in infrastructure, cloud services, software, cybersecurity, and skilled professionals.
Businesses should evaluate the expected benefits and total cost of ownership before implementing large-scale systems.
4. Shortage of Skilled Professionals
Successful analytics projects may require data engineers, data analysts, data scientists, machine learning specialists, and security professionals.
Finding and retaining qualified talent can be difficult for some organizations.
5. Data Integration Problems
Information may come from different platforms, databases, and file formats.
Integrating these sources into a consistent analytical environment can require significant technical work.
6. Managing Large Volumes of Information
As data grows, organizations need systems that can store, process, organize, and retrieve information efficiently.
7. Bias and Misleading Conclusions
Data may contain historical bias or incomplete representation of real-world conditions.
Poorly designed analytical models can produce misleading results. Organizations should validate models, examine assumptions, and monitor performance over time.
Big Data Analytics Tools and Technologies
Organizations use different technologies depending on their data requirements, technical capabilities, and budgets.
Tool or Technology | Main Purpose |
|---|---|
Apache Hadoop | Distributed storage and processing of large datasets |
Apache Spark | Large-scale data processing and analytics |
Python | Data analysis, automation, and machine learning |
R | Statistical analysis and data visualization |
SQL | Querying and managing structured data |
Tableau | Data visualization and business intelligence |
Microsoft Power BI | Reporting and interactive dashboards |
Google BigQuery | Cloud-based data warehousing and analytics |
Amazon Redshift | Cloud data warehousing |
Snowflake | Cloud data platform and analytics |
Apache Kafka | Real-time data streaming |
Apache Hadoop
Apache Hadoop is an open-source framework designed for distributed storage and processing of large datasets across multiple computers.
It is commonly associated with big data infrastructure and large-scale batch processing.
Apache Spark
Apache Spark is a distributed computing engine used for large-scale data processing, analytics, and machine learning workloads.
It supports different processing tasks and can work with data stored across various systems.
Python
Python is widely used in data analytics because of its extensive ecosystem of libraries.
Popular libraries include Pandas, NumPy, Matplotlib, and Scikit-learn.
Tableau and Power BI
Tableau and Microsoft Power BI help organizations transform data into visual reports and interactive dashboards.
These tools are especially useful for business intelligence and communicating analytical findings.
Cloud Analytics Platforms
Cloud platforms provide storage, processing, and analytics services without requiring every organization to build and maintain its own physical infrastructure.
Examples include Google BigQuery, Amazon Redshift, and Snowflake.
Big Data Analytics vs. Traditional Data Analytics
Traditional analytics and big data analytics both help organizations understand information, but they may differ in scale, complexity, and technology.
Feature | Traditional Data Analytics | Big Data Analytics |
|---|---|---|
Data Volume | Usually smaller datasets | Very large datasets |
Data Sources | Often limited | Multiple and diverse |
Data Types | Mostly structured | Structured, semi-structured, and unstructured |
Processing | Traditional databases and tools | Distributed and specialized systems |
Scalability | Often limited by existing infrastructure | Designed for large-scale workloads |
Analytics | Reporting and statistical analysis | Reporting, advanced analytics, and machine learning |
Examples | Spreadsheet sales report | Large-scale customer behavior analysis |
Traditional analytics remains useful for many business tasks. Big data analytics becomes valuable when the volume, speed, or variety of information requires more advanced infrastructure and processing methods.
Big Data Analytics vs. Business Intelligence
Big data analytics and business intelligence are related but are not identical.
Business intelligence (BI) generally focuses on organizing, reporting, and visualizing business information to support decision-making.
Big data analytics can include BI activities but also covers more advanced methods for analyzing large, complex datasets.
Feature | Business Intelligence | Big Data Analytics |
|---|---|---|
Main Focus | Business reporting | Large-scale data analysis |
Typical Questions | What happened? | What happened, why, and what may happen next? |
Data | Often structured | Multiple data types |
Tools | Power BI, Tableau | Spark, Python, Hadoop, cloud platforms |
Applications | Performance dashboards | Forecasting, pattern discovery, predictive models |
Both approaches can work together. For example, an organization may use big data technologies to process information and a BI dashboard to present the results to management.
How Artificial Intelligence Is Transforming Big Data Analytics
Artificial intelligence and big data analytics are closely connected.
Big data provides information for AI systems, while AI can help analyze large datasets more efficiently and identify patterns that may be difficult to detect manually.
Some important applications include:
Automated Data Analysis: AI-powered systems can assist with processing and examining large datasets.
Predictive Modeling: Machine learning algorithms can use historical data to estimate future outcomes.
Anomaly Detection: AI can identify unusual patterns in financial transactions, network activity, and industrial equipment.
Customer Personalization: Businesses can analyze customer behavior to improve product recommendations and services.
Natural Language Analytics: Some AI tools allow users to ask questions about datasets using everyday language.
However, AI-generated insights still require validation. Results depend on data quality, model accuracy, and appropriate human oversight.
How Small Businesses Can Use Big Data Analytics
Big data analytics is not limited to large corporations. Small businesses can use accessible analytics tools to make better decisions without building expensive data infrastructure.
Practical examples include:
1. Website Performance Analysis
Small businesses can examine website traffic, visitor behavior, popular pages, and conversion rates to improve their online presence.
2. Customer Segmentation
Businesses can group customers according to purchasing behavior, interests, and engagement.
This can help them create more relevant marketing campaigns.
3. Inventory Management
Retailers can examine sales history and demand patterns to improve stock planning.
4. Marketing Performance
Companies can compare advertising campaigns, monitor customer acquisition costs, and identify which channels generate valuable results.
5. Sales Forecasting
Businesses can use historical sales information to estimate future demand and plan resources.
Practical Starting Tools
Small businesses can begin with:
Google Analytics for website performance
Microsoft Excel for basic analysis
Google Sheets for organizing data
Power BI for dashboards
Python for advanced analysis
Cloud analytics services as requirements grow
The best approach is to start with a specific business question and use only the tools necessary to answer it.
Steps to Implement Big Data Analytics in a Business
A successful analytics project requires clear objectives, reliable information, suitable technology, and ongoing evaluation.
Step 1: Define Your Business Objectives
Identify the problem you want to solve.
Examples include improving customer retention, reducing operational costs, forecasting sales, or detecting fraud.
Step 2: Identify Relevant Data Sources
Determine where the necessary information exists.
This may include customer databases, websites, financial systems, sales platforms, and connected devices.
Step 3: Choose the Right Technology
Select storage, processing, and analytical tools according to your business requirements.
Avoid investing in complex platforms before understanding what your organization actually needs.
Step 4: Prepare and Clean Your Data
Check for missing values, duplicate records, inconsistent formats, and errors.
Reliable data is essential for meaningful analysis.
Step 5: Analyze the Information
Use statistical analysis, visualization, or machine learning techniques to identify patterns and answer business questions.
Step 6: Build Reports and Dashboards
Present results in a format that decision-makers can understand.
Dashboards can help managers monitor performance and identify important changes.
Step 7: Take Action and Measure Results
Use insights to improve business processes and monitor whether the changes produce the expected outcomes.
Step 8: Review and Improve
Analytics should be an ongoing process. Regularly review data quality, analytical models, security controls, and business objectives.
The Future of Big Data Analytics in 2026 and Beyond
Big data analytics continues to evolve as new technologies change how information is collected, processed, and used.
Several developments are shaping its future.
1. AI-Powered Analytics
AI is making it easier to examine complex datasets, automate analytical tasks, and identify patterns.
2. Real-Time Data Processing
Businesses increasingly need to analyze information as it arrives.
Real-time analytics can support applications such as fraud detection, network monitoring, and supply chain tracking.
3. Cloud-Based Analytics
Cloud platforms offer scalable storage and processing capabilities, allowing organizations to adapt infrastructure to changing requirements.
4. Edge Analytics
Edge computing allows some data processing to happen closer to the devices generating information.
This can reduce delays and limit unnecessary data transfers.
5. Data Democratization
More organizations are making analytics tools accessible to employees outside specialized technical teams.
Self-service dashboards and natural language interfaces can help nontechnical users explore information.
6. Stronger Data Governance
As organizations collect more information, data privacy, accuracy, ownership, and security will become increasingly important.
7. Predictive and Prescriptive Analytics
Businesses are moving beyond historical reporting toward forecasting and decision-support systems that recommend possible actions.
The organizations that combine reliable data, suitable technology, and responsible analytics practices will be better positioned to benefit from these developments.
Frequently Asked Questions About Big Data Analytics
1. What is big data analytics in simple words?
Big data analytics is the process of examining large amounts of information to discover patterns, identify trends, and make better decisions.
2. What are the five Vs of big data?
The five Vs are Volume, Velocity, Variety, Veracity, and Value. They describe the amount, speed, diversity, reliability, and usefulness of data.
3. What are the four types of big data analytics?
The four main types are descriptive, diagnostic, predictive, and prescriptive analytics. Each helps organizations understand past events, investigate causes, estimate future outcomes, or recommend actions.
4. What is an example of big data analytics?
An online retailer analyzing millions of customer purchases to forecast demand and recommend relevant products is an example of big data analytics.
5. Which tools are used for big data analytics?
Popular tools and technologies include Apache Hadoop, Apache Spark, Python, SQL, Tableau, Power BI, Google BigQuery, Amazon Redshift, and Snowflake.
6. How does big data analytics help businesses?
It can help businesses understand customers, improve operations, manage inventory, identify risks, measure marketing performance, and make more informed decisions.
7. What is the difference between big data and data analytics?
Big data refers to large and complex datasets. Data analytics refers to the process of examining data to find useful information. Big data analytics applies analytical methods to large and complex datasets.
8. Is big data analytics difficult to learn?
The difficulty depends on the level of expertise required. Beginners can start with spreadsheets, SQL, and basic statistics before moving to Python, data visualization, and distributed computing technologies.
9. What is predictive analytics?
Predictive analytics uses historical information, statistical methods, and machine learning to estimate possible future outcomes.
10. What is the future of big data analytics?
Its future will be influenced by AI-powered analysis, real-time processing, cloud computing, edge analytics, improved data governance, and more accessible analytical tools.
Conclusion
Big data analytics has become an important part of modern business technology. It helps organizations transform large amounts of raw information into useful insights that support better decisions, improved efficiency, and new opportunities.
From healthcare and banking to retail, manufacturing, transportation, and marketing, businesses are using analytics to understand complex challenges and improve their operations.
However, successful implementation requires more than collecting large amounts of information. Organizations must prioritize data quality, privacy, cybersecurity, suitable tools, and skilled professionals.
As artificial intelligence, cloud computing, and real-time processing continue to develop, big data analytics will play an increasingly important role in the digital economy.
For businesses looking to remain competitive, learning how to turn data into meaningful decisions is no longer optional. It is becoming a valuable part of long-term growth.