They decide what products to develop, which customers to target, how much inventory to maintain, where to invest resources, how to improve operations, and which opportunities deserve attention.
Some decisions are based on experience and professional judgment. Others are influenced by customer feedback, market conditions, financial information, and business performance.
Increasingly, businesses can also use data to make these decisions more informed.
Data can reveal patterns that may not be obvious from intuition alone. It can help organizations understand customer behavior, identify operational problems, measure performance, evaluate opportunities, and determine whether a strategy is producing the expected results.
However, simply collecting large amounts of information does not automatically lead to better decisions.
Businesses need to collect relevant data, ensure that it is reliable, interpret it correctly, and connect it to meaningful business questions.
The goal is not to become a company that measures everything.
The goal is to become a company that uses useful information to make smarter decisions.
What Is Data-Driven Decision-Making?
Data-driven decision-making is the practice of using relevant information and analysis to support business decisions.
Instead of relying entirely on assumptions or intuition, leaders examine available evidence before choosing a course of action.
For example, a business considering opening a new location might evaluate:
Customer demand
Existing sales
Local demographics
Operating costs
Competition
Customer traffic
Revenue potential
The data does not make the decision automatically.
Rather, it gives decision-makers additional information to consider.
Good business decisions often combine data, experience, context, and professional judgment.
Why Data Matters in Business
Data can help businesses understand what is happening inside and outside the organization.
It can answer questions such as:
Which products are performing well?
Which customers are most valuable?
Where are costs increasing?
Which marketing channels generate results?
Where are customers leaving?
Which processes are inefficient?
What problems are occurring repeatedly?
Which opportunities deserve further investigation?
Without reliable information, leaders may make decisions based on assumptions.
Data can provide another perspective.
Start With the Business Question
One of the most important principles of effective data use is to start with a question.
Do not begin by asking:
“What data can we collect?”
Instead, ask:
“What business problem are we trying to understand?”
For example:
Business problem: Sales have declined.
Useful questions:
When did sales begin declining?
Which products are affected?
Which customer groups changed their purchasing behavior?
Are competitors offering something different?
Has pricing changed?
Has customer traffic changed?
Are there operational problems affecting sales?
These questions determine what information the business actually needs.
Identify the Most Important Data
Businesses can collect enormous amounts of information.
But more data does not necessarily mean better decision-making.
Too much irrelevant information can make analysis more difficult.
Start by identifying the data that directly relates to the decision.
Depending on the business, useful information may include:
Sales data
Customer data
Financial data
Website traffic
Marketing performance
Inventory information
Operational data
Employee performance information
Customer feedback
Market research
The right data depends on the question being asked.
Understand Different Types of Business Data
Business data can come in many forms.
Quantitative Data
Quantitative data is numerical.
Examples include:
Revenue
Sales volume
Number of customers
Conversion rates
Operating costs
Website visits
Production levels
Numerical information can be useful for measuring changes and comparing performance.
Qualitative Data
Qualitative information describes opinions, experiences, and observations.
Examples include:
Customer feedback
Interviews
Employee comments
Product reviews
Survey responses
Qualitative information can help explain why something is happening.
A sales report might show that customers are buying less, while customer interviews may reveal that customers are unhappy with a new product feature.
Both forms of information can be valuable.
Use Data to Understand Customers
Customer data can help businesses understand who their customers are and how they interact with products or services.
Businesses may analyze:
Purchase history
Customer preferences
Website behavior
Feedback
Support requests
Repeat purchases
Customer retention
Product usage
This information can help organizations improve customer experiences.
For example, if customers repeatedly abandon a purchase process at the same step, the business may investigate whether that part of the process is confusing or inconvenient.
Segment Customers
Not all customers behave in the same way.
Customer segmentation involves grouping customers according to relevant characteristics or behaviors.
Businesses might analyze groups based on:
Purchasing behavior
Product preferences
Location
Business size
Frequency of purchases
Customer needs
Segmentation can help businesses develop more relevant products, services, communication, and marketing strategies.
The goal is not to treat customers as numbers.
It is to understand meaningful differences between groups.
Use Data to Improve Marketing Decisions
Marketing decisions can benefit significantly from data.
Businesses can compare the performance of different marketing activities.
For example, they may evaluate:
Website traffic
Leads
Conversion rates
Customer acquisition
Campaign performance
Email engagement
Advertising results
This can help determine which activities deserve additional attention.
However, businesses should avoid focusing on surface-level numbers alone.
A marketing campaign may generate many clicks but relatively few customers.
Another campaign may receive fewer clicks but produce more valuable customers.
The business should therefore evaluate metrics in context.
Understand the Difference Between Metrics and Goals
A metric is a measurement.
A goal is an intended outcome.
For example:
Metric: Website visits.
Goal: Generate qualified customer leads.
Increasing website visits may look positive, but if those visitors never become customers, the business may not be moving closer to its actual goal.
Effective data analysis connects measurements to business objectives.
Improve Financial Decisions
Financial data is essential for understanding business performance.
Leaders can use financial information to examine:
Revenue
Expenses
Profitability
Cash flow
Margins
Pricing
Debt
Investment
Operating costs
This information can help businesses identify areas that require attention.
For example, revenue may increase while profitability declines because operating costs are rising faster than sales.
Looking at revenue alone would hide this problem.
Use Data to Manage Cash Flow
Cash flow is particularly important for businesses.
A profitable company can still experience financial pressure if cash does not arrive when needed to cover expenses.
Businesses can use historical and current information to improve cash-flow planning.
They may examine:
Customer payment patterns
Recurring expenses
Supplier payments
Seasonal demand
Inventory costs
Expected revenue
Better visibility can help management prepare for potential cash-flow challenges.
Make Better Pricing Decisions
Pricing is one of the most important decisions a business makes.
Businesses can use data to understand:
Customer demand
Sales volume
Competitor pricing
Costs
Profit margins
Product performance
Customer responses to price changes
However, pricing should not be based solely on what competitors charge.
A business also needs to understand its own costs, value proposition, target customers, and strategic objectives.
Improve Inventory Management
For businesses that sell physical products, inventory can represent a significant investment.
Too much inventory can increase storage and carrying costs.
Too little inventory can result in missed sales and unhappy customers.
Data can help businesses identify:
Fast-moving products
Slow-moving products
Seasonal patterns
Reorder points
Inventory turnover
Demand trends
This information can support more informed purchasing and inventory decisions.
Improve Operational Efficiency
Data can help businesses identify where time, money, or resources are being wasted.
For example, a company might discover that:
A particular process takes much longer than expected.
A machine frequently requires maintenance.
Customer support receives repeated questions.
A particular step creates unnecessary delays.
Certain resources are consistently underused.
Once a problem is identified, leaders can investigate its cause and test possible improvements.
Use Data to Improve Customer Service
Customer-service information can reveal recurring problems.
Businesses can analyze:
Support requests
Complaint categories
Response times
Resolution times
Customer satisfaction
Repeat issues
If the same question appears repeatedly, the business may improve its documentation or product instructions.
If customers repeatedly experience the same problem, the underlying process may need to change.
Data can therefore help businesses move from reacting to individual complaints toward identifying systemic issues.
Use Employee Data Carefully
Businesses can also use information to understand workplace operations.
Relevant information might include:
Project completion
Productivity measures
Training participation
Employee feedback
Attendance patterns
Staff turnover
However, employee data requires careful handling.
Not every measurable activity represents meaningful performance.
For example, counting how many emails an employee sends does not necessarily indicate how valuable their work is.
Organizations should choose performance measures that reflect actual responsibilities and outcomes.
Use Data to Identify Trends
Looking at data over time can reveal patterns.
A single month's performance may not tell the full story.
A business may want to compare:
Month-to-month results
Seasonal performance
Product performance over time
Customer retention
Long-term costs
Revenue trends
Trend analysis can help leaders distinguish between temporary changes and more persistent developments.
Understand Seasonality
Many businesses experience seasonal changes.
Retail businesses may see different demand during holidays.
Travel companies may experience seasonal peaks.
Agricultural businesses naturally depend on growing and harvesting cycles.
Education-related businesses may follow academic calendars.
Understanding seasonality prevents businesses from interpreting normal seasonal changes as unexpected problems.
Use Dashboards to Make Information Easier to Understand
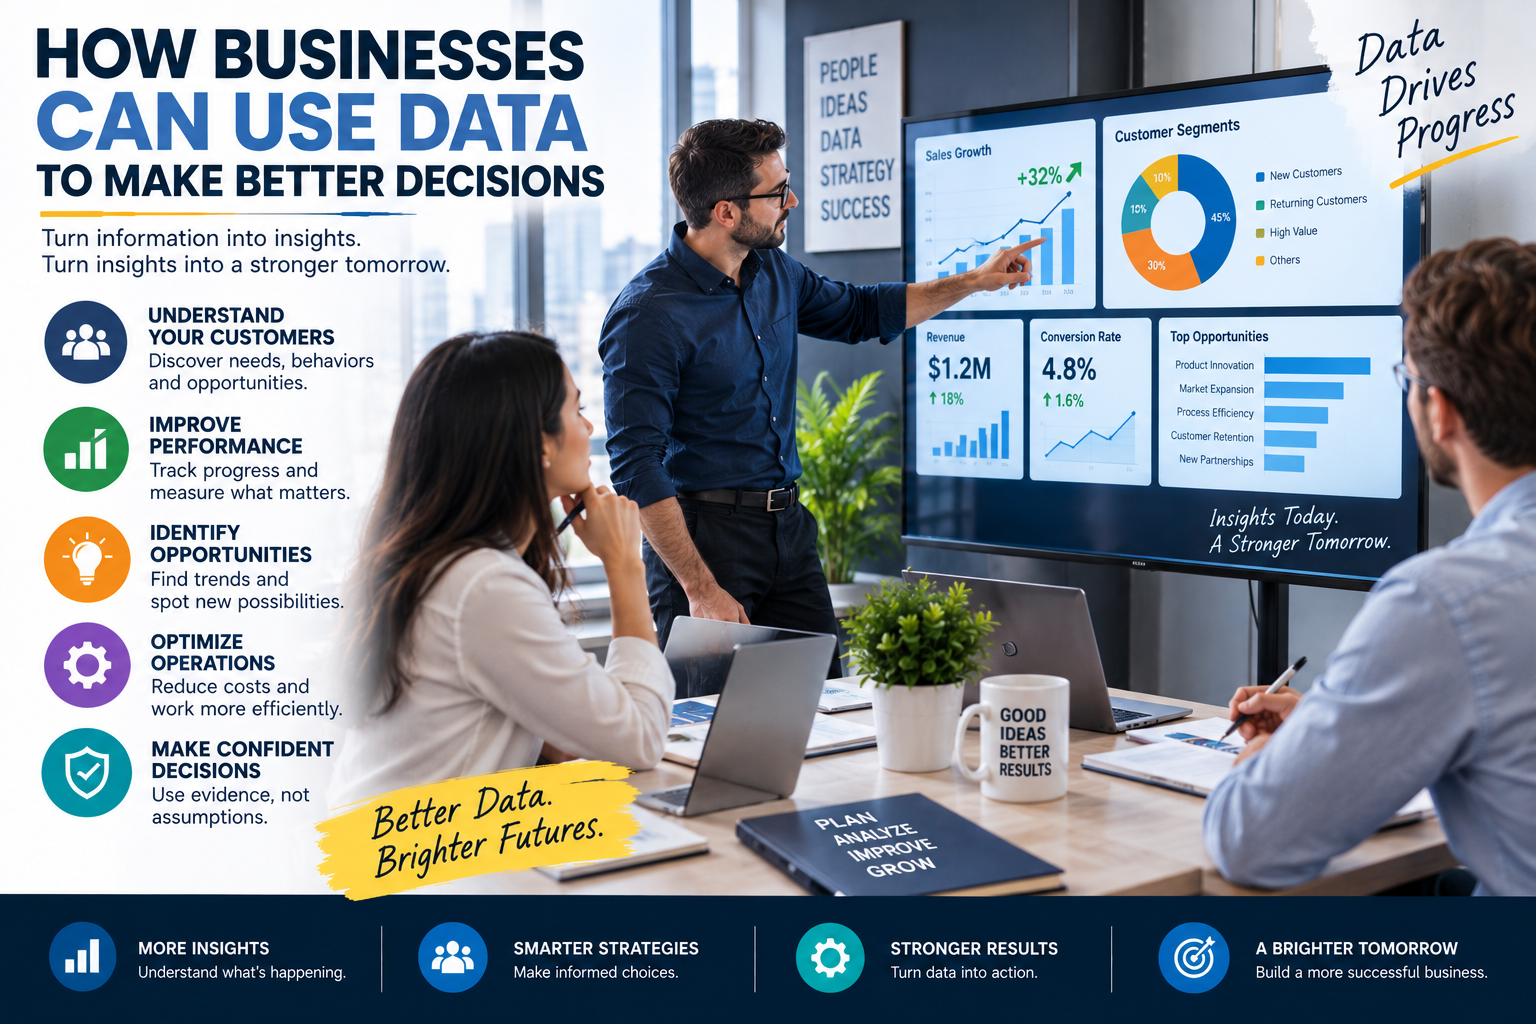
Business dashboards can bring important metrics together in one place.
A dashboard might display:
Revenue
Sales
Customer growth
Expenses
Website traffic
Conversion rates
Inventory
Project progress
The best dashboards are not necessarily the ones containing the most information.
They are the ones that make important information easy to understand.
A dashboard should help decision-makers answer:
What is happening?
Why might it be happening?
What requires attention?
Avoid Information Overload
A dashboard with dozens of charts can become difficult to use.
Businesses should prioritize the metrics that directly support important decisions.
For each metric, ask:
Why are we tracking this?
What decision will it influence?
What action would we take if it changes?
Is it actually useful?
If a metric does not contribute to decision-making, it may not deserve prominent attention.
Compare Actual Results With Expectations
Data becomes especially useful when actual performance is compared with expectations.
For example:
Expected sales: 100,000 units.
Actual sales: 82,000 units.
The difference creates a question.
Why did the result fall below expectations?
Possible explanations could include:
Lower demand
Supply problems
Pricing changes
Stronger competition
Marketing issues
Operational delays
This comparison can lead to deeper analysis.
Use Data to Test Ideas
Businesses frequently have ideas about what customers want.
Instead of immediately making a major investment, organizations can sometimes test those assumptions.
For example, a company considering a new product might conduct:
Customer surveys
Small pilot programs
Limited launches
A/B tests
Prototype testing
Testing can provide evidence before significant resources are committed.
The exact testing method depends on the business and decision.
Experimentation Can Reduce Uncertainty
No test can eliminate uncertainty completely.
However, small experiments can sometimes provide useful evidence at lower cost than a full-scale launch.
For example, a company might test two versions of a webpage with a limited audience before making a broader change.
The important principle is to define what the business is testing and what result would influence the next decision.
Use Data Alongside Human Experience
Data should not automatically replace experience.
Experienced employees often understand details that may not appear in numerical reports.
A sales manager may know why a particular customer is changing its purchasing behavior.
A customer-service representative may recognize a problem before it becomes visible in broader statistics.
A production employee may understand why a particular process is slowing down.
Data and human knowledge can complement each other.
Be Careful About Correlation
One of the most important concepts in data analysis is that correlation does not necessarily mean causation.
Two things may change at the same time without one causing the other.
For example, website traffic and sales may increase together.
That does not automatically prove that increased website traffic caused the entire increase in sales.
Other factors may also have changed.
Businesses should investigate possible causes before drawing strong conclusions.
Watch Out for Biased Data
Data can contain biases.
Bias can enter through:
How information is collected
Who is included
Which questions are asked
Which time periods are analyzed
Which metrics are selected
If a business only surveys its most loyal customers, it may miss the reasons other customers stopped purchasing.
Data quality depends partly on how the data was collected.
Data Quality Matters
Poor-quality data can lead to poor decisions.
Businesses should consider whether their information is:
Accurate
Complete
Consistent
Current
Relevant
Properly collected
Before building a strategy around a dataset, leaders should understand its limitations.
Reliable analysis begins with reliable information.
Protect Customer and Business Information
Data can be valuable, but it also creates responsibilities.
Businesses may handle sensitive information about customers, employees, suppliers, and operations.
Organizations should establish appropriate practices for:
Access control
Data storage
Security
Backups
Privacy
Retention
Responsible data use
Only appropriate people should have access to sensitive information.
Good data governance can help reduce unnecessary risks.
Build a Data-Driven Culture
Technology alone cannot create data-driven decision-making.
People need to understand why data matters and how to use it responsibly.
A data-driven culture encourages employees to ask:
What does the evidence show?
What are we assuming?
What information are we missing?
How confident are we in this conclusion?
This does not mean every decision needs a complicated analysis.
It means evidence becomes a normal part of business conversations.
Train Employees to Understand Data
Not everyone needs to become a data scientist.
But employees who regularly work with business information should understand basic concepts such as:
Metrics
Trends
Percentages
Averages
Comparisons
Correlation
Data quality
Basic data literacy can help employees interpret reports more effectively and ask better questions.
Give Data to the People Making Decisions
Data is most useful when it reaches decision-makers at the right time.
If a business collects information but the people responsible for decisions cannot easily access or understand it, its value is limited.
Information should be:
Relevant
Accessible
Timely
Understandable
The right information delivered too late may be almost as unhelpful as having no information at all.
Use Data to Improve Strategic Planning
Strategic planning involves decisions about the future direction of the business.
Data can support questions such as:
Which markets are growing?
Which products have the strongest potential?
Where are costs increasing?
Which customer groups are expanding?
What capabilities do we need?
Which investments deserve priority?
Leaders should combine this information with broader considerations such as competition, technology, customer needs, and organizational capabilities.
Data Can Help Businesses Respond to Change
Businesses operate in environments that can change unexpectedly.
Customer preferences may shift.
New competitors may enter the market.
Technology may change how products are delivered.
Supply conditions may change.
Economic circumstances can influence spending.
Regularly reviewing relevant information can help businesses recognize changes earlier.
The goal is not to predict everything.
It is to become better prepared to respond.
Create a Simple Data Decision-Making Process
Businesses can create a repeatable process for using data.
Step 1: Define the Decision
Clearly state what needs to be decided.
Step 2: Identify the Question
Determine what you need to understand.
Step 3: Gather Relevant Data
Collect information that directly relates to the question.
Step 4: Check Data Quality
Make sure the information is sufficiently accurate, current, and complete.
Step 5: Analyze the Information
Look for patterns, differences, trends, and possible explanations.
Step 6: Consider Alternatives
Do not assume there is only one possible solution.
Step 7: Make the Decision
Combine evidence with experience, context, and judgment.
Step 8: Measure the Result
Determine what happened after the decision.
Step 9: Learn and Adjust
Use the result to improve future decisions.
This creates a continuous cycle of learning.
Common Mistakes Businesses Make With Data
Collecting Data Without a Purpose
Information should support meaningful questions.
Tracking Too Many Metrics
More measurements can create confusion.
Ignoring Data Quality
Inaccurate information can lead to misleading conclusions.
Looking Only at Short-Term Results
Some business decisions require a longer perspective.
Ignoring Qualitative Information
Customer and employee experiences can provide important context.
Treating Data as Absolute Truth
Data requires interpretation.
Confusing Correlation With Causation
Two things changing together does not automatically mean one caused the other.
Failing to Act
Data has little value if organizations repeatedly analyze information without making decisions.
The Role of Technology and AI in Business Data
Modern technology can make data analysis faster and more accessible.
Businesses can use software to organize information, create dashboards, identify patterns, automate reports, and support analysis.
AI can also assist with certain analytical tasks, such as summarizing information, identifying patterns, generating questions, and helping users explore datasets.
However, AI-generated analysis should be reviewed carefully.
Business decisions can have financial and operational consequences, so organizations should verify important findings and understand how conclusions were reached.
Start Small
Businesses do not need an enormous data infrastructure to begin making better decisions.
Start with one important business question.
For example:
Why are repeat purchases declining?
Identify the relevant data.
Analyze the trend.
Speak with customers.
Develop possible explanations.
Test an improvement.
Measure the result.
Then repeat the process.
Small improvements can eventually develop into a stronger data-driven culture.
Data Should Lead to Action
The ultimate purpose of business data is not to create more reports.
It is to support better action.
A useful analysis should ideally help answer:
What should we do next?
If a report identifies a problem but nobody knows what action should follow, the analysis may need to be reframed.
Good data practices connect information to decisions.
Final Thoughts
Data can become one of the most valuable resources available to a modern business, but only when it is used thoughtfully.
Businesses can use data to understand customers, improve marketing, manage finances, optimize operations, evaluate opportunities, monitor performance, and respond to changing conditions.
The most effective approach is not to collect as much information as possible.
It is to ask better questions and use relevant information to answer them.
Strong data-driven organizations also understand the limits of data. They recognize the importance of human judgment, context, experience, and qualitative information.
The best business decisions often come from combining reliable evidence with thoughtful leadership.
As technology continues to make information more accessible, businesses have greater opportunities to make informed decisions. Organizations that learn how to turn useful data into meaningful action can improve their ability to adapt, innovate, and compete over the long term.
Frequently Asked Questions
1. What is data-driven decision-making?
Data-driven decision-making is the practice of using relevant information and analysis to support business decisions rather than relying entirely on assumptions or intuition.
2. Why is data important for businesses?
Data can help businesses understand customers, measure performance, identify problems, improve operations, evaluate opportunities, and make more informed decisions.
3. What types of data do businesses use?
Businesses may use sales, financial, customer, marketing, operational, inventory, website, employee, and market data, depending on their goals.
4. Does every business need advanced data analytics?
No. Businesses can start with simple reports, spreadsheets, dashboards, customer feedback, and basic performance measurements before adopting more advanced analytical systems.
5. How can data improve customer decisions?
Customer data can help businesses understand purchasing behavior, preferences, feedback, retention, and common problems, allowing them to improve products and customer experiences.
6. How can data improve marketing?
Marketing data can help businesses evaluate campaigns, traffic, leads, conversions, customer acquisition, and other performance indicators.
7. What is data quality?
Data quality refers to how accurate, complete, consistent, current, and relevant information is for the purpose in which it is being used.
8. What is a business dashboard?
A business dashboard is a visual tool that presents important performance information, often through charts, tables, and key metrics.
9. How can businesses avoid information overload?
Businesses can focus on a smaller number of metrics directly connected to important goals and decisions rather than trying to monitor everything.
10. Can data replace human judgment?
Data can support decision-making but does not necessarily replace human judgment. Experience, context, creativity, and understanding of people remain important.
11. What is the difference between quantitative and qualitative data?
Quantitative data is generally numerical and measurable, while qualitative data describes experiences, opinions, observations, and other non-numerical information.
12. How can small businesses use data?
Small businesses can use sales records, customer feedback, website statistics, financial information, inventory records, and simple spreadsheets to support decision-making.
13. What is data-driven culture?
A data-driven culture is an organizational environment where employees regularly use relevant evidence, analysis, and information to support decisions and evaluate results.
14. Can AI help businesses analyze data?
AI can assist with certain data-analysis tasks, including summarizing information, identifying patterns, generating questions, and supporting analysis. Important conclusions should still be reviewed.
15. What is correlation?
Correlation describes a relationship or association between variables. It does not automatically prove that one variable caused another.
16. Why should businesses combine data with customer feedback?
Numerical data can show what is happening, while customer feedback can sometimes help explain why it is happening.
17. How can data improve financial decisions?
Financial data can help businesses understand revenue, expenses, cash flow, profitability, pricing, margins, and investment decisions.
18. How can data help businesses identify problems?
Businesses can analyze trends, performance differences, customer complaints, costs, delays, and other indicators to identify areas requiring investigation.
19. How often should businesses review their data?
The appropriate frequency depends on the type of data and the decision. Some information may need daily monitoring, while strategic trends may be more useful when reviewed over longer periods.
20. What is the most important principle of data-driven decision-making?
Start with a clear business question, use relevant and reliable information, consider the evidence carefully, make a decision, and measure the outcome.